
What you will find on this page: LATEST NEWS; largest glacier calving ever filmed (video); 2025 AMS International “State of the Climate” Report; how climate change impacts daily average temperatures (interactive map); watch La Nina fade & El Nino approach (video); Shifting ocean currents; Rivers in the sky; Atlantic Ocean current slowing; heatwaves at both poles; State of climate 2021; Hockey Stick graphs: Human influence warming climate; dangerous humid heat arriving decades early; ANU’s annual environmental scorecard (report); understanding Oz natural hazards; rising cost of natural disasters for Oz (report); there goes the neighbourhood (housing, investment report); weather and climate change (video); over reliance on satellite data; impacts projected for Australia; latest report 2016 (report); unpacking IPCC report for Australia; fluctuations in temperature trend; El Nino/La Nina/ENSO explained (video); NASA El Nino visual (video); climate zones on the move; abrupt changes, triggers & tipping points; projections as a management tool; extreme events; bushfire/wildfire (video); heat waves; storms and floods; hurricanes/cyclones and climate change/what we know; water scarcity & drought; impacts happening now; sea level rise (videos & interactive maps); ocean warming is not just about temperature – acidification (video); Great Barrier Reef; NASA’s Global Ice Viewer; ANTARCTICA (video); permafrost; 2024 NOAA Arctic Report Card, rapid dramatic change; 2021 Artic report card; ARCTIC (video): Arctic causing loopier weather – continuing debate (video); Arctic report card 2017 (video & report) how the Arctic matters (video); Arctic loss continues (video); sea ice decline (video); human impacts on world oceans; information and resource sites; for BOM updates go here; also refer to pages: Mainstreaming our changing climate; Population & Consumption; People Stress; Food & Water Issues; Ecosystem Stress as the issues are closely related
Latest News 16 October 2025, The conversation: The climate crisis is fuelling extreme fires across the planet. We’ve all seen the alarming images. Smoke belching from the thick forests of the Amazon. Spanish firefighters battling flames across farmland. Blackened celebrity homes in Los Angeles and smoked out regional towns in Australia. If you felt like wildfires and their impacts were more extreme in the past year – you’re right. Our new report, a collaboration between scientists across continents, shows climate change supercharged the world’s wildfires in unpredictable and devastating ways. Human-caused climate change increased the area burned by wildfires, called bushfires in Australia, by a magnitude of 30 in some regions in the world. Our snapshot offers important new evidence of how climate change is increasing the frequency and severity of extreme fires. And it serves as a stark reminder of the urgent need to rapidly cut greenhouse gas emissions. The evidence is clear – climate change is making fires worse… In the past year, a land area larger than India – about 3.7 million square kilometres – was burnt globally. More than 100 million people were affected by these fires, and US$215 billion worth of homes and infrastructure were at risk. In Australia, bushfires did not reach the overall extent or impact of previous seasons, such as the Black Summer bushfires of 2019–20. Nonetheless, more than 1,000 large fires burned around 470,000 hectares in Western Australia, and more than 5 million hectares burned in central Australia. In Victoria, the Grampians National Park saw two-thirds of its area burned. Read more here 7 October 2025, Insurance Council of Australia: Extreme weather costs: the silver medal we don’t want. New data released by the Insurance Council of Australia (ICA) today shows that Australia has consistently taken the silver medal for extreme weather losses over the last 45 years – beaten only by the United States. The data uses both the insured and broader economic costs of extreme weather, averaged across the populations of each of six developed countries in order to accurately compare the growing impact of extreme weather. Published as part of the ICA’s annual 2024-25 Insurance Catastrophe Resilience Report, the data from Munich Re’s NatCatSERVICE global database shows that for most of the last 45 years Australia has ranked second only behind the United States for economic and insured losses per capita – and was only pushed into third place in the last five years by two extraordinary events in New Zealand. Each decade since 1980, inflation-adjusted losses from floods, bushfires, storms and extreme cold temperatures have climbed across the globe, with the Report looking at France, Canada, and Germany in addition to Australia, New Zealand and the United States. Australia’s persistent second place reflects our unique geography and exposure to natural perils, compounded by the growth of populations in higher-risk areas and infrastructure that has not been built to withstand the impacts of a changing climate. Also included in the Report is updated data on the cost of extreme weather over the past 12 months, with insured losses reaching almost $2 billion across three events – the North Queensland Floods ($289m), Ex-Tropical Cyclone Alfred ($1.43b), and the Mid North Coast and Hunter floods ($248m). Read more here 7 October 2025, The Conversation: Extreme weather now costs Australians $4.5b a year. Better insurance options and loans would help us adapt. Today’s release of the Insurance Council of Australia’s report puts Australia on the spot: we rank second in the world in extreme weather-related losses. As the Insurance Council puts it, this is not the silver medal we want to win. Why is this a problem? According to the Resilient Building Council of Australia, a collaboration of independent experts, close to 90% of Australian homes are not actually fit for a changing climate. Many renters, low income groups, and people living in high-risk areas are especially vulnerable and often unable to even get insurance. In the 2020s, Australia has spent around A$4.5 billion a year on extreme weather costs, while insurance affordability and access are plummeting in regions that need it the most. The report found almost eight in ten of the homes that face severe to extreme flood risk do not have flood insurance. Australia’s first National Climate Risk Assessment, released last month, predicted a staggering 444% increase in heat-related deaths in Sydney as heatwaves become more severe under the most extreme scenario of 3°C degree warming by 2050. Other very dire numbers are outlined for climate risks across the country. The insurance industry says we need to rethink how we can keep our communities safe and thriving in the face of escalating disasters. How do we make sure these safety nets actually work for people – especially when costs and losses are escalating? Read More Here 20 October 2025, Aljazeera: UN pushes for worldwide disaster alerts as extreme weather ‘spirals’. Climate-related hazards have killed more than 2 million people in 50 years, said the UN’s meteorological agency, 90 percent of them in developing countries.Nearly half of all countries lack early-warning systems for extreme weather events, leaving millions – especially those in developing nations – vulnerable. As it released a new report on Monday, the UN’s World Meteorological Organization (WMO) called for gaps in global monitoring and forecasting networks to be plugged. Timely alerts are crucial to saving lives as extreme weather events multiply due to climate change, it warned. “Many millions of people lack protection against dangerous weather, which is inflicting an increasing toll on economic assets and vital infrastructure,” said a statement by the WMO, noting that disaster-related deaths are six times higher in countries without early-warning systems.Read more here End Latest News 14 August 2025, AMS: International “State of the Climate” report confirms record-high greenhouse gases, global temperatures, global sea level, and ocean heat in 2024. According to the 35th annual State of the Climate report, greenhouse gas concentrations, the global temperature across land and oceans, global sea level, and ocean heat content all reached record highs in 2024, and glaciers lost the most ice of any year on record. The international review of the world’s climate, published by the Bulletin of the American Meteorological Society (BAMS), is based this year on contributions from 589 scientists in 58 countries. For decades, the State of the Climate has provided the most comprehensive annual update on Earth’s climate — illuminating not only key indicators like global CO2 but also notable weather events, regional phenomena, and other data collected by environmental monitoring stations and instruments located on land, water, and ice, as well as in space. “The State of the Climate report is an annual scientific landmark,” says American Meteorological Society President David J. Stensrud. “It is a truly global effort, in which hundreds of researchers from universities, government agencies, and more come together to provide a careful, rigorously peer-reviewed report on our planet’s climate. High-quality observations and findings from all over the world are incorporated, underscoring the vital importance of observations to monitor, and climate science to understand, our environment. The results affirm the reality of our changing climate, with 2024 global temperatures reaching record highs.” The full report can be downloaded from this page. Notable findings from the international report include: The latest State of the Climate report is out, and there’s not much good news for Australians. Our climate has warmed by an average 1.47℃ since national records began, bringing the continent close to the 1.5℃ limit the Paris Agreement hoped would never be breached. When global average warming reaches this milestone, some of Earth’s natural systems are predicted to suffer catastrophic damage. The report, released today, paints a concerning picture of ongoing and worsening climate change. In Australia, associated impacts such as extreme heat, bushfires, drought, heavy rainfall, and coastal inundation threaten our people and our environment. The report is a comprehensive biennial snapshot of the latest trends in climate, with a focus on Australia. It’s compiled by the Bureau of Meteorology and CSIRO, drawing on the latest national and international climate research. Access article here; access report here CLIMATE CENTRAL: Global Temperature Climate Shift Map – Visualize the Climate Shift Index ™: how climate change impacts daily average temperatures. Put in a date and watch the map change: Link to map here 18 May 2023, NOAA – Climate .gov: As we blogged about earlier this month, the odds that El Niño—the warm phase of the planet’s most powerful natural climate pattern, the El Niño-Southern Oscillation—will emerge in the tropical Pacific Ocean later this year continue to rise. One sign that El Niño is on its way is the rapid shift from cool to warm ocean surface temperatures in the heart of the tropical Pacific. This animation shows weekly temperatures across the Pacific Ocean compared to the long-term average from December 5 to May 14. Cooler-than-average waters are blue; warmer than average waters are orange to red. The key area for monitoring La Niña and El Niño is outlined with a black rectangle. Week by week, cooler surface waters are gradually replaced by warmer waters from the east. Read more here. You’ve probably heard a lot about La Niña lately. This cool weather pattern is the main driver of heavy rain and flooding that has devastated much of Australia’s southeast in recent months. You may also have heard of El Niño, which alternates with La Niña every few years. El Niño typically brings drier conditions to much of Australia. Together, the two phases are known as the El Niño-Southern Oscillation – the strongest and most consequential factor driving Earth’s weather. And in recent years there has been much scientific interest in how climate change will influence this global weather-maker. Our new research, released today, sheds light on the question. It found climate change will clearly influence the El Niño-Southern Oscillation by 2030 – in just eight years’ time. This has big implications for how Australians prepare for extreme weather events. Read more here The oceans absorb more than 90% of all extra heat trapped by the emissions we’ve produced by burning fossil fuels. This heat is enormous. It’s as if we exploded an atom bomb underwater, every second of every day. The ocean isn’t warming at the same rate everywhere. We know the heat is concentrated in the fast, narrow currents that flow along the east coasts of the world’s continents and funnel warm water from the tropics down towards the poles. In the Southern Hemisphere, these currents – known as the western boundary currents – are warming faster than the global average at their southern limits, creating ocean warming hotspots. Access more here 24 February 2022, NOAA Climate.gov: Guest co-author Dr. Kai-Chih Tseng is a postdoctoral research scientist at Princeton University and the NOAA Geophysical Fluid Dynamics Laboratory who is an expert on climate variability and prediction, including the study of atmospheric rivers. In the summer of 2022, Dr. Tseng will begin an assistant professor position in the Department of Atmospheric Science at National Taiwan University. Atmospheric rivers are long, narrow corridors of moisture-laden air extending from the tropics to higher latitudes. They can produce heavy rain and snowfall in short periods of time, especially when the air is lifted over high terrain, cooling the air and condensing the moisture into droplets, like wringing out an atmospheric sponge. When you see these impressively long features on satellite imagery, it’s no wonder that they are compared to rivers. In fact, an average atmospheric river carries 25 times the amount of water as the Mississippi River! They form when warm, moist air in lower latitudes is transported poleward like a conveyor belt ahead of a trailing cold front from a powerful mid-latitude storm. Around the globe, atmospheric rivers are responsible for more than 90% of the water vapor that is transported to the mid-latitudes from the tropics and are a critical source of water for many regions, such as California and Nevada. They also can be quite destructive, causing severe flooding and damaging winds, with the strongest atmospheric rivers in the western U.S. typically causing damages in the hundreds of millions of dollars (1). Read full article here 7 June 2022, The Conversation: A huge Atlantic ocean current is slowing down. If it collapses, La Niña could become the norm for Australia. Climate change is slowing down the conveyor belt of ocean currents that brings warm water from the tropics up to the North Atlantic. Our research, published today in Nature Climate Change, looks at the profound consequences to global climate if this Atlantic conveyor collapses entirely. We found the collapse of this system – called the Atlantic meridional overturning circulation – would shift the Earth’s climate to a more La Niña-like state. This would mean more flooding rains over eastern Australia and worse droughts and bushfire seasons over southwest United States. East-coast Australians know what unrelenting La Niña feels like. Climate change has loaded our atmosphere with moister air, while two summers of La Niña warmed the ocean north of Australia. Both contributed to some of the wettest conditions ever experienced, with record-breaking floods in New South Wales and Queensland. Meanwhile, over the southwest of North America, a record drought and severe bushfires have put a huge strain on emergency services and agriculture, with the 2021 fires alone estimated to have cost at least US$70 billion. Read more here. 21 March 2022, The Guardian: Antarctic areas reach 40C above normal at same time as north pole regions hit 30C above usual levels. Startling heatwaves at both of Earth’s poles are causing alarm among climate scientists, who have warned the “unprecedented” events could signal faster and abrupt climate breakdown. Temperatures in Antarctica reached record levels at the weekend, an astonishing 40C above normal in places. At the same time, weather stations near the north pole also showed signs of melting, with some temperatures 30C above normal, hitting levels normally attained far later in the year. At this time of year, the Antarctic should be rapidly cooling after its summer, and the Arctic only slowly emerging from its winter, as days lengthen. For both poles to show such heating at once is unprecedented. The rapid rise in temperatures at the poles is a warning of disruption in Earth’s climate systems. Last year, in the first chapter of a comprehensive review of climate science, the Intergovernmental Panel on Climate Change warned of unprecedented warming signals already occurring, resulting in some changes – such as polar melt – that could rapidly become irreversible. The danger is twofold: heatwaves at the poles are a strong signal of the damage humanity is wreaking on the climate; and the melting could also trigger further cascading changes that will accelerate climate breakdown. Read more here State of the climate: Summer 2021 sets new high for average land temperature 19 October 2021, Carbon Brief: State of the climate: Summer 2021 sets new high for average land temperature. The summer of 2021 saw extreme heat events, extreme rainfall and flooding, catastrophic wildfires and other extreme events across the world. (These were discussed in-depth in a Carbon Brief guest post published last month.) With data through to the end of the summer now available, Carbon Brief can now confirm that the northern-hemisphere summer of 2021 was the warmest on record for the world’s land areas – and the fourth warmest June-July-August period on record for the globe as a whole (ocean, land and air). While global temperatures are a key indicator of climate change, no human experiences the global average. Land regions have, on average, warmed around 50% faster than the world as a whole, with higher latitude land regions warming faster still. The figure below shows June-to-August temperatures from the Berkeley Earth dataset between 1850 and 2021. Each red dot represents the average temperature over the three months. Read more here Northern-hemisphere summer (June, July, August) average land surface temperatures from Berkeley Earth. Anomalies plotted with respect to a 1850-1900 baseline. Chart by Carbon Brief using Highcharts. Hockey Stick graphs: Human influence warming climate 12 May 2020, NOAA: “It’s not the heat, it’s the humidity.” On a hot day, that expression rings true. Sticky, tropical-like air makes extreme heat a greater health risk. Climate models project that combinations of heat and humidity could reach deadly thresholds for anyone spending several hours outdoors by the end of the 21st century. New research says these extremes are already happening—decades before anticipated—due to global warming to date. The paper authors used an index called “wet-bulb temperature” based on weather station temperature and humidity data. The reading, from a thermometer when covered in a wet cloth, is related to how muggy conditions feel. This map shows locations that experienced extreme heat and humidity levels briefly (hottest 0.1 percent of daily maximum wet-bulb temperatures) from 1979–2017. Read more here How Much Warming? September 2018: From NOAA This short video, is the fifth in the National Academies Climate Change, Lines of Evidence series. It focuses on greenhouse gases, climate forcing (natural and human-caused), and global energy balance. Australia’s 2017 environment scorecard: like a broken record, high temperatures further stress our ecosystems 12 April 2018, The Conversation, While rainfall conditions were generally good across Australia in 2017, record-breaking temperatures stressed our ecosystems on land and sea, according to ANU’s annual environmental scorecard. Unfortunately, it looks like those records will be broken again next year – and again in the years after that.National-scale, comprehensive information on the condition, change and trajectory of our environment. The Australia’s Environment report aims to make spatial information on environmental conditions more accessible and easily interpreted at different levels of detail. Information can be accessed in different ways: Read More here and access the scorecard here Australian natural hazards series – take your pick…. November 2016, The Conversation, Articles on Australian natural hazards series which looks at: Rising cost of natural disasters in Australia How big is the problem? There have been few attempts to estimate the total amount of Australian housing exposed to the effects of climate change. Coastal erosion alone is estimated to pose a threat to Australian property worth up to $63 billion (in 2008 dollars).6 This figure would be $88 billion in 2015, when adjusted in line with the increase in the national value of residential dwelling stock.7 However even that updated figure is highly likely to be conservative, as detailed in Appendix 3. Few comprehensive studies have been conducted in specific local areas. One exception is Townsville, where a detailed study concluded that almost 4,400 houses would be potentially inundated by 2100 due to sea level rise alone – that is, excluding storm surges, king tides, and other potentially compounding events. The report recommended that some houses would need to be effectively abandoned. In cases where steps could be taken to mitigate impacts to some areas, action needed to be taken as early as 2027…. …. People often expect insurance to cover every kind of damage to their homes, but that is not always the case. The Climate Institute’s recent paper, There goes the neighbourhood states that, while insurers could do better in communicating increasing risks of extreme weather, we can’t expect the insurance industry to protect us from all the costs of increasing frequent and extreme weather events. The same goes for local government-funded mitigation such as seawalls and groynes, which are costly and can be extremely contentious among local communities, as events in Byron Shire illustrate. There goes the neighbourhood points out that states and the federal government need to take stronger action to coordinate information and responses. They will also need to take stronger action to help limit global warming driving climate impacts. …. Climate change is now widely recognised as presenting potential financial risk. Investors and other financial agents must decide exactly how they respond and take advantage of the opportunities which might arise. In contrast to some of the other broad changes under way, such as technological disruption and geopolitical shifts, there is a reasonable amount of empirical information about how climate change might affect investors and other financial agents. However, taking a position is not possible if you don’t know what the exposure is. For this reason, financial institutions are increasingly being asked by shareholders to measure and disclose their exposure to carbon risk. ANZ’S carbon risk ANZ commissioned my organisation, The Climate Institute, to comment on its new carbon risk disclosures, released with its interim results on May 3. We applaud the acknowledgement that climate risk should be measured and disclosed. But what do these disclosures tell us? With respect to ANZ’s financed emissions disclosure, counting up the amount of greenhouse gas emissions ‘financed’ by a bank or other financial institution is a fraught and complex exercise. There have been attempts by industry-backed initiatives, third-party analysts and NGOs. Banks are complex. …. Governments, by contrast, are supposed to represent all of society. So who will protect the people hurt by this disaster, and others like them, as the sea level rises and extreme weather damages more homes and businesses? Is it even possible to protect them? And if so, who should pay? These are all questions we should be asking. In fact, they’ve been asked many, many times before. By the Productivity Commission (twice, in 2012 and 2014), the Treasury, the Australian Government Actuary, industry groups, cross-industry alliances, a national inquiry into disaster insurance, various discussion papers, and more – ourselves at The Climate Institute included. It is not as if we don’t know what needs to be done. It is no wonder that the Productivity Commission dryly mentioned that “groundhog day anecdotes abound” in this area. “Current government natural disaster funding arrangements are not efficient, equitable or sustainable,” the Commission wrote. “They are prone to cost shifting, ad hoc responses and short-term political opportunism.” FOR AN IN DEPTH LOOK AT HOW OUR CHANGING CLIMATE IS BEING MAINSTREAMED GO HERE Over reliance on satellite data in isolation 14 January, Yale Climate connections: Experts Fault Reliance on Satellite Data Alone. Over-reliance on satellite data to the exclusion of other data can amount to ‘confirmation bias,’ say scientists urging analysis of numerous different data sets. This month’s “This is Not Cool” video focuses on an ongoing, and again festering, climate science controversy, the value and reliability of satellite-derived global temperatures. And of that data at the exclusion of – or as a surrogate for – other data. Independent videographer Peter Sinclair sought reactions of leading climate scientists to points made in a recent hearing of the Senate Commerce, Science and Transportation Committee, chaired by Texas Republican Senator and presidential nominee hopeful Ted Cruz. Read More here LATEST REPORT: State of the Climate 2016 The Bureau of Meteorology and CSIRO play an important role in monitoring, analysing and communicating observed changes in Australia’s climate. This fourth, biennial State of the Climate report draws on the latest monitoring, science and projection information to describe variability and changes in Australia’s climate, and how it is likely to change in the future. Observations and climate modelling paint a consistent picture of ongoing, long-term climate change interacting with underlying natural variability. These changes affect many Australians, particularly changes associated with increases in the frequency or intensity of heat events, fire weather and drought. Australia will need to plan for and adapt to some level of climate change. This report is a synthesis of the science informing our understanding of climate in Australia, and includes new information about Australia’s climate of the past, present and future. The science underpinning this report will help inform a range of economic, environmental and social decision-making and local vulnerability assessments, by government, industry and communities. Read More here KEY POINTS: The extent of future negative impacts often determined by how quickly temperatures rise As Prof. Garnaut stated in one of his reports: “The future climate is a function of both human-induced climate change and natural climate variability. In some decades natural variability will reinforce the climate change signal. In other decades, it will offset the signal to some degree. Projections of global average temperature across different emissions cases show little variation up to the decade beginning in 2030. After this point, projections of climate variables are increasingly dependent on emissions pathways.” In other words “things” will basically tick along much like they are doing but after 2030 we will begin to enter unknown territory, especially if there are no SIGNIFICANT efforts to reduce emissions well before then. Read More here Unpacking the IPCC’s 5th Assessment Report: Impacts, Adaptation and Vulnerability (Working Group II): Climate Council of Australia 2014 Report What does this mean for Australia? Increased drought frequency is expected in southern Australia, with decreases in the amount of rainfall by as much as 10% by 2030, and by up to 30% by 2070. These upper-limit scenarios would have important implications for regional agriculture, rural livelihoods, ecosystems, and urban water supply. Uncertainty in the scale of projected rainfall changes means that effective adaptation to these risks will be particularly challenging. An increased number of hot days is one of the most direct consequences of global warming. Air temperature in Australia has increased at a rate of 0.09°C each decade since 1911. Since 1950 there has been significant warming across the continent, particularly over inland areas. Hot days and hot nights have become more frequent. Similarly, hot extremes have become more frequent and intense, while cold extremes have become rarer. Increased hot weather is expected to have significant impacts in major population centres, with hot days, for example, in Melbourne expected to increase 20 – 40% by 2030, and up to 190% by 2070. The 2009 Victorian heatwave was associated with over 300 excess deaths and contributed significantly to increased heat-related morbidity. Vulnerable sections of society, such as the elderly and people with pre-existing medical conditions, will be affected disproportionately. The intense 2009 Victorian bushfires caused 173 deaths and destroyed over 2,000 buildings. Similar bushfire events may become more frequent. Australian fire danger weather has increased in some areas around Australia since the 1970s. Hotter and drier conditions in southern Australia mean that fire danger weather is projected to increase in this region. Under certain scenarios, Australia is likely to see an increase in days of very high and extreme fire danger. For example, Canberra currently experiences an average of 17 days per year of very high and extreme fire danger index. This is expected to increase to 18-23 days by 2020, and to 20-33 days by 2050. The severity of some key regional risks is dependent on a large range of climate variables, even for a particular global average temperature increase. However, if the most extreme scenarios occur, these risks would be severe. Widespread drought in southeast Australia (1997-2009), including the southern Murray Darling Basin was associated with a decrease in southern Murray Darling Basin GDP by nearly 6% in 2007/2008. Dry conditions and resulting economic downturn can have substantial impacts on local industry, the national economy, and the health (particularly mental health) of rural communities. Projected changes in exposure to heat under a high emissions scenario (A1FI). Maps show the average number of days with peak temperatures >40°C, for ~1990 (based on available meteorological station data for the period 1975-2004), ~2050 and ~2100. Bar charts show the change in population heat exposure, expressed as person-days exposed to peak temperatures >40°C, aggregated by State/Territory and including projected population growth for a default scenario. Future temperatures are based on simulations by the GFDL-CM2 global climate model (Meehl et al., 2007), re-scaled to the A1FI scenario; simulations based on other climate models could give higher or lower results. Data from Baynes et al. (2012). Source: IPCC 2014b Refer also to: Fluctuations in temperature trend There has been an ongoing debate, over recent years, fuelled by deniers about the stopping or slowing trend of increasing surface temperatures. Earth systems are complex and science understanding continues. 4 June 2015, Carbon Brief, No ‘slowdown’ in global surface temperatures after all, study finds. A new paper published today says the much-discussed “slowdown” in warming at Earth’s surface may not exist after all. Points of clarity (Source: Carbon Brief) The so-called “hiatus” has never been about a reduction in the speed of “global” warming. It relates only to the temperature at the Earth’s surface. When you look at all the components of the climate system – land and vegetation, ice cover and the ocean – scientists have no doubt that the planet as a whole is warming up. Since the IPCC report, a lot of research has been published looking at how natural variability could be contributing to slower surface warming by reshuffling heat between the atmosphere and the oceans. On top of the long-term warming trend from greenhouse gases, these natural fluctuations in the climate system can temporarily boost or dampen the speed of warming, causing global temperatures to temporarily rise above or below the long-term average. Scientists use thousands of temperatures measurements from ships, drifting buoys and weather stations on land to construct records of global temperature. The new paper addresses some well-known issues with how the data is all pieced together. First, is how to combine traditional ship-based measurements of sea surface temperature with those collected by the ARGO network of free-floating buoys, operating since the early 2000s. Another issue is how to account for changes over time in the way ships collect temperature data while on the move. There is also the well-known problem of having little data available in the Arctic. Scientists have developed various ways to “correct” for all these issues. The new paper uses an approach developed by NOAA scientists – some of whom are authors of the new paper. While the authors apply their corrections to the full temperature record stretching back to 1880, the biggest impact is on the rate of warming in recent decades, say the authors. El Nino/La Nina/ENSO explained FOR MORE BUREAU OF METEOROLOGY OM REPORTS AND INFO GO TO BOM UPDATES PAGE HERE NASA Sees a Different Kind of El Niño 26 February 2016: A new NASA visualization shows the 2015 El Niño unfolding in the Pacific Ocean, as sea surface temperatures create different patterns than seen in the 1997-1998 El Niño. Computer models are just one tool that NASA scientists are using to study this large El Nino event, and compare it to other events in the past. Access website page here for more. While the “intelligent” species of this planet continue the never ending talkfest on the merits or otherwise of responding to climate change the rest of the travellers on Planet Earth are speaking with their feet/roots/wings/ wriggly bits. The debate for them is irrelevant they need to move, and are, to ensure their own survival. We unfortunately, other than the main cause for the need for them to move, are often in the way. A dilemma for us all. If you are looking for a simple way of explaining this plight I found the following excellent: Trees On The Move As Temperature Zones Shift 3.8 Feet (1.2m) A Day (19 February 2014) by Robert Krulwich You are a snail. You are a plant. You like where you are. The temperature’s right. It suits you. Something is not right. And though you can’t know this, there’s a reason: The whole planet is getting warmer, which means that temperature zones are shifting. Warmer areas are expanding, pushing cooler zones closer to the North and South Poles, so that the meadow, the forest, the tundra, the desert, the plains — wherever you live — your ecosystem is beginning to shift. Over the decades, the climate you prefer has started to migrate away from you, which raises an intriguing question: “If I’m standing in a landscape,” asked Stanford ecologist Scott Loarie a few years ago, “how far do I have to travel in order to change my temperature” – to get back to the climate that suits me? Loarie, Chris Field, and their colleagues at the Carnegie Institution for Science gathered all the data they could from climate change studies in order to measure “temperature velocity,” or, as Scott put it in a podcast at the time, “How fast is temperature change sweeping across the Earth’s surface?” In 2009, they came up with an answer, published in the science journal, Nature. As a global average, they said, temperatures are changing at a rate of 0.42 kilometers — or roughly, a quarter mile a year, which means that if you are standing on a patch of earth, climate zones are moving at a rate (on average) of about 3.8 feet every day. Think about this for a moment. For birds, butterflies, bears — critters with legs and wings — catching up with your old climate (as it moves away from you at 3.8 feet a day) seems very doable. If you’re a lot smaller — a snail, a beetle — it’s harder. And if you can only wiggle, like an earthworm, it’s even rougher. But, in general, a 3.8-feet-a-day rate seems hard, but not impossible. Remember, however: This is an average, and averages can mask very different underlying rates. Everybody knows temperatures change very fast when you are climbing a mountain. Mountains are change-friendly. Even mountains have their problems. The higher you go, the narrower it gets. Some critters can move up, but not everybody. It’ll get too crowded. So far I’ve only mentioned animals, but animals have to eat, nest, seek shelter. It’s no good moving to a place where the berries you need, the leaves you need aren’t available. Some moving animals need moving plants. Can plants do it too? Well, in a way they can. Trees, for example, can push their seeds in a desirable direction. After the last great ice age, as it warmed, temperate forests (with help from birds, wind and berry-eating bears) moved north at a rate of more than half a mile per year. This time, can the plants keep up? Dashing Trees: Miles Silman, a forest ecologist at Wake Forest University, has been pondering this question. He (and others) have been looking hard at patches of forest on the slopes of the Andes mountains in Manú National Park in Peru. The trees in each patch have been counted, measured, watched, providing a good baseline to see how things have changed. As described by Elizabeth Kolbert in her new book, The Sixth Extinction, one of Silman’s grad students, Kenneth Feeley, and his colleagues discovered that trees on these mountain slopes are already in motion. Not all trees, though. Just some. Feeley looked at changes over a 4-year period, and found that trees have been moving up to get cooler at an average rate of 8 feet a year; but some, Kolbert writes, were “practically hyperactive.” Trees from the genus Schefflera, (which we know as part of the gingseng family) were “racing up the ridge at the astonishing rate of nearly a hundred feet a year.” Wow! On the lazier side, when the scientists looked at the genus Ilex (a group of trees that, in North America, include the Christmas holly), those trees weren’t moving at all, essentially. They’d spent the four years, “more or less inert.” “As the climates change,” Chris Field said in the podcast, “plants and animals, at least in principle have the potential to stay in the climate they’re in now. … But the conclusion from our study is that they have to move pretty fast in order to be able to do that.” And a lot of them, Field thinks, won’t make it. Some animals will migrate north, but won’t find the food they need. Trees may find new zones, only to be inhabited (or attacked) by a new set of animals and pests. Old arrangements will break down. The key, say the authors of this study, is to make sure movement is possible. What about our National Parks? We have, of course, set aside huge swaths of land to protect plants and animals. We’ve got Yellowstone, and even bigger African preserves. But the temperature zones are moving so fast, the Carnegie scientists say, that even in these immense spaces, less than 10 percent of protected areas globally will maintain current climate conditions within their boundaries 100 years from now. We humans, having tried to stay out their way, are now back in their way. We need to back off and let them through — but will we? I wonder. 12 October 2015 Yale Environment 360, The Rapid and Startling Decline Of World’s Vast Boreal Forests. Scientists are becoming increasingly concerned about the fate of the huge boreal forest that spans from Scandinavia to northern Canada. Unprecedented warming in the region is jeopardizing the future of a critical ecosystem that makes up nearly a third of the earth’s forest cover. The boreal forest wraps around the globe at the top of the Northern Hemisphere in North America and Eurasia. Also known as taiga or snow forest, this landscape is characterized by its long, cold and snowy winters. In North America it extends from the Arctic Circle of northern Canada and Alaska down into the very northern tip of the United States in Idaho, Washington, Montana, and Minnesota. It’s the planet’s single largest biome and makes up 30 percent of the globe’s forest cover. Moose are the largest ungulate in the boreal, adapted with their long legs to wade in its abundant marshes, lakes and rivers eating willows, aspen and other plants. In the southern boreal forest of northern Minnesota, moose were once plentiful, but their population has plummeted. Thirty years ago, in the northwest part of the state, there were some 4,000; they now number about a hundred. In the northeast part, they have dropped from almost 9,000 to 4,300. They’ve fallen so far, so fast that some groups want them listed as endangered in the Midwest. Read More here Abrupt changes, triggers and tipping points 18 October 2015, Climate News Network, Climate changes can kick in below 2°C limit. Sudden shifts in settled climates can occur long before global warming reaches the internationally-agreed safety level, European scientists say. Climate change could arrive with startling speed. New research has identified at least 37 “tipping points” that would serve as evidence that climate change has happened – and happened abruptly in one particular region. And 18 of them could happen even before the world warms by an average of 2°C, the proposed “safe limit” for global warming. Weather is what happens, climate is what people grow to expect from the weather. So climate change, driven by global warming as a consequence of rising carbon dioxide levels, in response to more than a century of fossil fuel combustion, could be – for many people – gradual, imperceptible and difficult to identify immediately. But Sybren Drijfhout, of the University of Southampton in the UK and his collaborators in France, the Netherlands and Germany, are not so sure. They report in the Proceedings of the National Academy of Sciences that they “screened” the massive ensemble of climate models that inform the most recent reports from the Intergovernmental Panel on Climate Change, and found evidence of abrupt regional changes in the ocean, the sea ice, the snow cover, the permafrost and in the terrestrial biosphere that could happen as average global temperatures reached a certain level. The models did not all simulate the same outcomes, but most of them did predict one or more abrupt regional shifts. No safe limit. But the future is not an exact science. “Our results show that the different state-of-the-art models agree that abrupt changes are likely, but that predicting when and where they will occur remains very difficult,” said Professor Drijfhout. “Also, our results show that no safe limit exists and that many abrupt shifts already occur for global warming levels much lower than two degrees.” The idea of a “tipping point” for climate change has been around for decades: the hypothesis is that a climate regime endures – perhaps with an increasing frequency of heat waves or windstorms or floods – as the average temperatures rise. However, at some point, there must be a dramatic shift to a new set of norms.Read More here 14 July 2014, The Conversation: What climate tipping points should we be looking out for? The concept of a “tipping point” – a threshold beyond which a system shifts to a new state – is becoming a familiar one in discussions of the climate. Examples of tipping points are everywhere: a glass falling off a table upon tilting; a bacterial population hitting a level where it pushes your body into fever; the boiling point of water, or a cube of ice being thrown into warm water, where it rapidly melts. The ice cube is a poignant example, because scientists now fear that West Antarctica’s ice sheets are also heading towards irreversible melting. Likewise, the recent discovery of deep canyons beneath the Greenland ice sheet raises concerns regarding its stability. The history of the atmosphere, oceans and ice caps indicates that, once changes in the energy level which drive either warming or cooling reach a critical threshold, irreversible tipping points ensue. Read More here Projections as a management tool An excellent resource well worth investigating: The Climate Change in Australia website provides easy access to the projections information and data. The website houses 14 interactive tools for exploring data; a data download facility; a technical report describing the data sources, methods, observed changes and projections; reports and brochures that summarise the results for eight regions of Australia; a brochure on Data Delivery; a brochure on projections for selected cities; a Climate Campus for learning more about climate science and using projections in impact assessments; an online training course; and other resources for decision makers and communicators. It is often stated that people have been dealing with “extreme events” ever since Adam was a boy, what is so different with climate change? The difference is that it is projected that as temperatures rise not only severity increases but the number of occurrences can also increase. The outcome being people/communities do not have time to recover fully before they face another “event”. 29 May 2015, Inside Climate News, Weather Extremes Wear Climate Change’s Fingerprints: Extreme heat in India, flooding in Houston, wildfires in Alberta suggest a new normal, made more chaotic by global warming. Communities across the globe got a sobering snapshot this week of what the future is likely to hold more of: extreme weather getting even more extreme thanks to climate change. Historic rainfall and flooding in Texas and Oklahoma left thousands homeless and dozens of people dead. India is in the midst of a prolonged heat wave that has already claimed more than 1,800 lives. Wildfires in Alberta consumed hundreds of square miles of forest while creeping closer to Canada’s tar sands, shutting down production of the carbon-intense fossil fuel. Read More here Australian Academy of Science: With its iconic reference to ‘droughts and flooding rains’, Dorothea Mackellar’s 1904 poem My Country highlights the large natural variations that occur in Australia’s climate, leading to extremes that can frequently cause substantial economic and environmental disruption. These variations have existed for many thousands of years, and indeed past floods and droughts in many regions have likely been larger than those recorded since the early 20th century. This high variability poses great challenges for recording and analysing changes in climate extremes not just in Australia, but the world over. Nevertheless, some changes in Australia’s climate extremes stand out from that background variability. Human-induced climate change is superimposed on natural variability. For example, in recent decades, hot days and nights have become more frequent, more intense and longer lasting in tandem with decreases in cold days and nights for most regions of the globe. Since records began, the frequency, duration and intensity of heatwaves have increased over large parts of Australia, with trends accelerating since 1970. Extremes are expected to change in the future. As the climate continues to warm in response to further greenhouse gas emissions, high temperature extremes will become hotter and cold extremes will become less cold. Read More here 18 February 2020, CSIRO Bushfire Report: The bushfires experienced in the 2019-20 season have so far burned more than 10 million hectares of land in southern Australia, greater than the combined area burned in the Black Saturday 2009 and Ash Wednesday 1983 bushfires. But what causes these bushfires and why has this bushfire season been so significant? The CSIRO has been undertaking bushfire research for almost 70 years. This factsheet, with advice from other specialist organisations, provides some insights. 1. Climate change is increasing the risk of bushfires in Victoria and lengthening fire seasons. 2. Victoria is the state in Australia that is most affected by bushfires and is on the frontline of increasing bushfire risk. 3. The economic cost of bushfires in Victoria is projected to more than double by 2050. 4. Bushfires will continue to adversely affect human and environmental health. 5. In the future, Victoria is very likely to experience an increased number of days with extreme fire danger. Communities, emergency services and health services across Victoria must keep preparing. 6. Reducing emissions is critical to protecting Australians. Sept 2010, NASA Thousands of wildfires large and small are underway at any given time across the globe. Beyond the obvious immediate health effects, this “biomass” burning is part of the equation for global warming. In northern latitudes, wildfires actually are a symptom of the Earth’s warming. ‘We already see the initial signs of climate change, and fires are part of it,” said Dr. Amber Soja, a biomass burning expert at the National Institute of Aerospace (NIA) in Hampton, Va. 7 August 2016 Yale Climate Connections: Wildfire is an important part of the ecology of the western United States. Some trees native to this region actually require fire to reproduce. But in Colorado, a fast-warming climate, drought, tree-killing insects, and human suppression of natural wildfire have combined to create the fuel and the conditions for fires that go far beyond what’s beneficial. Wildfires now burn bigger, faster, longer, and well outside what’s considered the normal “fire season.” To describe this new reality, director Daniel Glick created Unacceptable Risk, a short film about the experiences of firefighters on the front lines. GLICK: “We felt that firefighters are among the more trusted sources out there. So when a firefighter gets up there and says, ‘Climate change has changed my life,’ I think it’s a way of conveying the science in a really human way, through storytelling.” The film outlines how more frequent wildfires – combined with a fast-growing population spreading over larger areas – are stretching firefighting resources thin. And it explains why limiting climate change is critical to protect firefighters on the front lines. Read More here 16 December 2015, CSIRO and Ngadju tackle bushfires in the Great Western Woodlands. Old and new ways of fire management are coming together to help protect one of the most unique woodlands on the planet. Members of the Ngadju community began working with CSIRO about four years ago to help prevent fires in the Great Western Woodlands (GWW) in south-western Australia. The Great Western Woodlands are located in south-western Australia. The GWW is the largest remaining tract of dry climate woodland on Earth. The region receives as little as 250 mm rain per year. Owing to the variable rainfall and lack of readily accessible groundwater suitable for livestock, much of the region has remained virtually unchanged since European settlement. However during recent years, the GWW has experienced an increase in the frequency of large, intense wildfires causing fire-sensitive old-growth woodlands to be lost at an alarming rate. Leslie Schultz from Ngadju Conservation believes climate change is contributing to the increase in fires. “The heat we get now is harsher and when it does come, there’s less rain—this can only spell trouble for the Woodlands,” he said. Les said the relationship between Ngadju and CSIRO was born from his own experience of “burning off country”—something he learnt from his elders. “We need to control the country so it doesn’t control us,” Les said. “We want to incorporate our traditional land management methods. We managed our country not with rakes, shovels and bulldozers but with fire.” The insight and the benefits of utilising Indigenous fire knowledge was no more apparent than during the recent devastating bushfires in Western Australia. These fires damaged large areas of the GWW directly. In the nearby community of Esperance one fire led to the loss of four lives, with reportedly more than 280,000 hectares of farmland burnt, along with houses, sheds, machinery and almost 5,000 livestock. Ngadju mobilised to help fight these fires and provided valuable insight into the current landscape. They also currently operate a small ranger team in the GWW and undertake a mix of contract land management. Working with Indigenous community members during major fire outbreaks and for long term fire management was cemented as an initiative in 2012 when CSIRO researchers and the Ngadju people began collaborating on the Ngadju Kala (fire) Project. Read More here From the Climate Council of Australia’s report – Be Prepared: Climate Change and the Victorian bushfire threat (2014). The Australia Seasonal Bushfire Outlook for 2014–15, issued in September 2014, anticipates the severity of the bushfire season in different states. For the first time this outlook has been reissued (November 2014) due to unseasonably hot, dry weather in Australia’s southeast (See Figure 7). Victoria’s 2014–15 bushfire season outlook has been upgraded from an above normal fire season to a major fire season. All Victorian districts, except the Mallee and East Gippsland, may expect above normal fire potential (Bushfire and Natural Hazards CRC 2014b). 3 June 2014, ABC Catalyst: How will the rise of mega-fires affect life as we know it? Reporters Anja Taylor and Mark Horstman travel to opposite sides of the planet to find out. Even the origin of fire is tied to the origin of plants. Fire couldn’t exist here until the fuel and oxygen from land plants made this planet flammable. So for nearly half a billion years, the Earth has been in flames. In turn, fire shapes the patterns of life, the climate, and ultimately, our own survival. But fire is changing. Over the past decade, every forested continent has seen an alarming surge in large, uncontrollable fires. Mega-fires. 7 March 2017: Angry Summer 2016/17: Climate Change Super-Charging Extreme Weather 1. The Australian summer of 2016/17 marked the return of the Angry Summer with record-breaking heat especially in the east of the nation. The Angry Summer was characterised by intense heatwaves, hot days and bushfires in central and eastern Australia, while heavy rainfall and flooding affected the west of the country. Noteworthy records from this summer include: 4. The costs of the extreme heat are clear with reduced work productivity, increasing risk of bushfires and escalating damage to the Great Barrier Reef. Why do sustained extreme high temperatures kill? 23 July 2010, Scientific American, How Does a Heat Wave Affect the Human Body? Some might like it hot, but extreme heat can overpower the human body. An expert from the CDC explains how heat kills and why fans are worthless in the face of truly high temperatures. Climate change promises to bring with it longer, hotter summers to many places on the planet. With more heat waves on the horizon, the risk of heat-related health problems has also been on the rise. Heat exhaustion is a relatively common reaction to severe heat and can include symptoms such as dizziness, headache and fainting. It can usually be treated with rest, a cool environment and hydration (including refueling of electrolytes, which are necessary for muscle and other body functions). Heat stroke is more severe and requires medical attention—it is often accompanied by dry skin, a body temperature above 39.4 degrees C, confusion and sometimes unconsciousness. But when sustained heat waves hit a region, the other health ramifications can be serious, including sunstroke and even major organ damage due to heat. As temperatures linger above our bodies’ own healthy internal temperature for longer periods of time, will we humans be able to take the heat? Mike McGeehin, director of the CDC’s Environmental Hazards and Health Effects Program, provides some answers. Continue reading here for his answers. Southern Storms: Climate change and extreme weather events KEY POINTS: THE INFLUENCE OF CLIMATE CHANGE ON HEAVY RAINFALL: The heavy downpours across southeast Australia are yet another reminder of how extreme weather events place lives, property and critical infrastructure at risk. Climate change is intensifying many extreme weather events in an atmosphere that is warmer and wetter because of increasing greenhouse gas emissions from human activities, primarily the burning of fossil fuels – coal, oil and gas. Hurricanes/cyclones and Climate Change: What We Know 13 September 2017, Climate Council: Hurricane Briefing Paper. Climate change, driven by the burning of coal, oil and gas, is influencing all extreme weather events. These extreme weather events include hurricanes (referred to as “Tropical Cyclones” in Australia) – because they are now occurring in a more energetic climate system with a hotter, moister atmosphere. Already, this Atlantic hurricane season has seen devastation with Hurricane Harvey bringing extremely intense and prolonged rainfall and flooding to Texas and Louisiana. Analysis by MetStat (2017) reveals that over a 5-day period the storm delivered 1-in-25,000 year rainfall to a widespread area. Less than a week after this storm, which resulted in more than 70 deaths and left tens of thousands homeless, Hurricane Irma left a trail of destruction and devastation across the Caribbean and Florida. This hurricane was one of the most powerful hurricanes on record, with the highest recorded wind speed reaching almost 300 km per hour. At least 50 people have been killed by Irma, and the damage bill of both Hurricanes Irma and Harvey is expected to be approximately $200 billion. Access Briefing Paper here Cyclones in Australia: General projections for the future: An increase is likely in the proportion of the most intense tropical cyclones, those with stronger winds and heavier rainfall such as Yasi, while the total number of tropical cyclones will likely decrease. A greater proportion of Tropical Cyclones may reach further south along Australia’s east and west coastlines (CSIRO and BoM 2015). Access fact sheet here Exploring the potential causes of increased storm intensity 2015, Union of Concerned Scientists, Hurricanes and Climate Change: Exploring the potential causes of increased storm intensity. Hurricanes, typhoons, and cyclones have always bedeviled coasts, but global warming may be making matters worse. Sea level is rising and will continue to rise as oceans warm and glaciers melt. Rising sea level means higher storm surges, even from relatively minor storms, which increases coastal flooding and subsequent storm damage along coasts. In addition, the associated heavy rains can extend hundreds of miles inland, further increasing the risk of flooding. In a tropical cyclone, air rotates inward to the center (or eye), then rises to higher altitudes. As warm, moist air rises, the air cools and condenses to rain, releasing heat. This cycle of evaporation and condensation powers the storm. Image: Adapted from a figure courtesy of NOAA. Recent scientific evidence suggests a link between the destructive power (or intensity) of hurricanes and higher ocean temperatures, driven in large part by global warming. With rapid population growth in coastal regions placing many more people and structures in the path of these tropical cyclones there is a much greater risk of casualties, property damage, and financial hardship when these storms make landfall. Hurricane Behaviour: Meteorologists use the term “tropical cyclone” for a closed atmospheric circulation that forms over a tropical or subtropical ocean. Once maximum sustained wind speed exceeds 74 miles per hour these storms are called hurricanes in the Atlantic Ocean, typhoons in the Pacific Ocean, and cyclones elsewhere. Many factors influence tropical cyclone behaviour, but three factors must be present for them to intensify: warm ocean temperatures (hurricanes can occur when surface ocean temperatures exceed about 79 degrees Fahrenheit (26 degrees Celsius), low vertical wind shear (i.e., no strong change in wind speed or direction between two different altitudes), and high humidity. As warm, moist air rises, it lowers air pressure at sea level and draws surrounding air inward and upward in a rotating pattern. As the water vapor-laden air spirals in and rises to higher altitudes, it cools and releases heat as it condenses to rain. This cycle of evaporation and condensation brings the ocean’s heat energy into the vortex, powering the storm. There are several natural factors that can “put the brakes on” a tropical cyclone: moving over colder ocean water; strong winds that churn up colder ocean water; high wind shear that can diminish or destroy the vortex; dry air migrating to the hurricane’s core; and moving over land, which creates high frictional drag and deprives the storm of warm ocean “fuel.” But as long as conditions are favourable, the storm will thrive. The Effect of Global Warming: Two factors that contribute to more intense tropical cyclones-ocean heat content and water vapour-have both increased over the past several decades. This is primarily due to human activities such as the burning of fossil fuels and the clearing of forests, which have significantly elevated carbon dioxide (CO2) levels in the atmosphere. CO2 and other heat-trapping gases act like an insulating blanket that warms the land and ocean and increases evaporation. The world’s oceans have absorbed about 20 times as much heat as the atmosphere over the past half-century, leading to higher temperatures not only in surface waters (e.g., depths of less than 100 feet) but also down to substantial depths, with the most severe warming occurring in the first 1,500 feet below the surface. As this warming occurs, the oceans expand and raise sea level. This expansion, combined with the inflow of water from melting land ice, has raised global sea level more than one inch over the last decade. In addition, observations of atmospheric humidity over the oceans show that water vapour content has increased four percent since 1970; because warm air holds more water vapour than cold air, these findings correlate with an increase in air temperature. To read full article including recent scientific developments – Read More here 14 May 2018, Carbon Brief, Climate change is already making droughts worse. Dr Benjamin Cook is a climate scientist at the NASA Goddard Institute for Space Studies and the Lamont-Doherty Earth Observatory. Few areas of the world are completely immune to droughts and their often-devastating impacts on water resources, ecosystems and people. Regions as diverse as California, the Eastern Mediterranean, East Africa, South Africaand Australia have all experienced severe – and, in some cases, unprecedented – droughts in recent years. As with other climate and weather extremes, such as storms and floods, these events have spurred strong interest in questions surrounding the impact of climate change. For example, is climate change making droughts more frequent or severe? And can we expect climate change to contribute to increased drought risk and severity in the future? The most recent research shows climate change is already making many parts of the world drier and droughts are likely to pack more punch as the climate warms further. Defining drought Droughts are among the most expensive weather-related disasters in the world (pdf), affecting ecosystems, agriculture and human society. The scale of the impacts underlines how important it is to understand droughts and how their likelihood and severity can be made worse by climate change. But this is easier said than done. For a start, drought is fundamentally a cross-disciplinary phenomenon – it extends across the fields of meteorology, climatology, hydrology, ecology, agronomy, and even sociology, economics, and anthropology. This means how you define a drought may depend on your field of interest. A meteorologist might characterise a drought as a straightforward lack of rainfall (known as “meteorological drought”). A farmer, however, would be most concerned when the lack of rain affects soil moisture and crop growth (“agricultural drought”). While a hydrologist would be most interested in when this has a noticeable impact on river flows, aquifers and surface reservoirs (“hydrological drought”). Read more here. 18 September 2017 Climate Council report: Hot and Dry: Australia’s Weird Winter. Climate Change made Australia’s warmest winter on record an astounding 60 times more likely, our new report highlights. The “Hot & Dry: Australia’s Weird Winter,” report shows the nation experienced its warmest winter on record (for average maximum temperatures), while more than 260 heat and low rainfall records were also broken throughout the season. Climate Councillor and ecologist, Professor Lesley Hughes said Australia’s hottest winter in history was related to worsening climate change. Access report here KEY FINDINGS INCLUDE: Whilst some parts of Australia are getting wetter, particularly the northwest of the continent, some of the most populous and agriculturally productive regions in the south are becoming drier (CSIRO Report: State of the Climate 2014: Figure 6) 2015, Climate Council of Australia’s report: Thirsty Country: Climate Change and Drought in Australia – Key findings: Drought can be defined in a variety of different ways. In terms of its links to climate change, drought is best defined as meteorological drought, which is ‘a prolonged, abnormally dry period when the amount of available water is insufficient to meet our normal use’ and is generally measured by assessing rainfall deficiencies over three or more months (BoM 2014c). In addition to meteorological drought, two other definitions of drought are used by different economic sectors or areas of research: agricultural drought, which is measured through deficits in soil moisture, and hydrological drought, which is based on anomalies in stream flow, lake and/or groundwater levels (IPCC 2012). Both of these definitions are important in terms of understanding the impacts of drought, and the consequences of climate change for these impacts. Drought has significant impacts on health, the economy, ecosystems and urban water supplies. Health: Droughts can have wide ranging effects on health including on nutrition, infectious diseases, on forest fires causing air pollution, and mental health problems, such as post-traumatic stress and suicidal behaviour (Haines et al 2006; Climate Commission 2011). Droughts can also contribute to increases in mortality rates. The World Meteorological Organization (WMO) has linked drought to 680,000 deaths globally from 1970–2012 (WMO 2014). Economic: Drought affects agriculture, tourism, employment and livelihoods in Australia, with severe economic repercussions. Between 2002 and 2003 decreases in agricultural production due to drought resulted in a 1% reduction in the Gross Domestic Product (GDP) and a 28.5% fall in the gross value added for the agricultural industry compared to the preceding year (ABS 2004). Ecosystems: Drought has significant impacts on Australia’s natural environment. For example, aquatic ecosystems are often affected by drought, with decreased water supplies reducing the availability of suitable habitat and leading to reductions in the populations of many fish and invertebrate species and, in some cases, contributing to local extinctions (Bond et al. 2008). Urban water supplies: Water scarcity in major cities, particularly Melbourne, Sydney and Perth, has been exacerbated by drought and remains an ongoing challenge. As of 2013, 89 percent of Australia’s population lived in urban areas (World Bank 2013), placing high demand on urban water supplies as populations continue to grow. Pressure on urban water supplies is projected to intensify as droughts increase in frequency and severity in the southwest and southeast (Collett and Henry 2011). Read Full Report here Access ALL Climate Council – Reports and news; renewables here Want to see potential impact of sea level rise 2100? JUNE 2016: Coastal Risk Australia BETA: Predicted Coastal Flooding Resulting from Climate Change. Want to know what the Australian coastline may look like in 2100? This BETA version of Coastal Risk Australia (CRA) has been opened for public consultation to show you what the Australian coast may look like in 2100. It is an interactive map tool designed to communicate coastal inundation associated with sea level rise to the year 2100. Using Google Earth Engine technology, CRA allows you to investigate the extent of coastal inundation using the latest 3D models of the Australian coastline. Data have been captured using airborne LiDAR technology to create detailed digital elevation models (DEMs), which are then combined with ‘bucket-fill’ inundation modelling to create the map-based visualisations. Access site and interactive maps here Canute provides estimates of the likelihood of future flooding from the sea. By combining two uncertainties (the frequency of present storm surges and the uncertainty of future sea-level rise) into a single likelihood, a statistically robust prediction is generated. Canute allows you to select your location of interest from over 12,000 datapoints at roughly 2.5km resolution around the whole Australian coastline via a map interface. You then select a future greenhouse gas emission scenario and your time period of interest. The tool calculator will then output a graph indicating the probability of experiencing at least one flooding event during this period (red line) for a range of design heights. For comparison an equivalent probability curve for conditions of constant sea level (set at the value for the year 2000) is also plotted (blue line). 26 August 2015, NASA The fingerprints of sea level rise. When you fill a sink, the water rises at the same rate to the same height in every corner. That’s not the way it works with our rising seas. According to the 23-year record of satellite data from NASA and its partners, the sea level is rising a few millimeters a year — a fraction of an inch. If you live on the U.S. East Coast, though, your sea level is rising two or three times faster than average. If you live in Scandinavia, it’s falling. Residents of China’s Yellow River delta are swamped by sea level rise of more than nine inches (25 centimeters) a year. These regional differences in sea level change will become even more apparent in the future, as ice sheets melt. For instance, when the Amundsen Sea sector of the West Antarctic Ice Sheet is totally gone, the average global sea level will rise four feet. But the East Coast of the United States will see an additional 14 to 15 inches above that average. Read More here For thousands of years, sea level has remained relatively stable and human communities have settled along the planet’s coastlines. But now Earth’s seas are rising. Globally, sea level has risen about eight inches (20 centimeters) since the beginning of the 20th century and more than two inches (5 centimeters) in the last 20 years alone. All signs suggest that this rise is accelerating. While NASA and other agencies continue to monitor the warming of the ocean and changes to the planet’s land masses, the biggest concern is what will happen to the ancient ice sheets covering Greenland and Antarctica, which continue to send out alerts that a warming planet is affecting their stability. Read More here Sea level is rising fast – and it seems to be speeding up: have shown that sea level rose steadily over the 20th century – and at a faster rate than over the previous centuries. It is also clear from both satellite and coastal observations that seas have risen faster over the past two decades than they did for the bulk of the 20th century. More recently, several studies have shown that the flow of ice and water into the oceans from Greenland and West Antarctica has increased since 1993. This raises an interesting question: has the rate of sea-level rise changed since 1993, when satellite observations began to give us a more complete picture of the global oceans? Our new research tackles this question by comparing satellite observations of sea level with those measured at the coast by tide gauges. We use this comparison to determine small biases in the satellite data that have changed over time. Understanding how the land supporting the tide gauges is moving becomes an important part of these comparisons. We found three important results. First, the seas really have risen faster since 1993, relative to the slower rate over previous decades as evident in the tide gauge data. Second, comparison of the coastal and satellite measurements reveal small differences in the early part of the satellite record from 1993 to 1999. After allowing for land motion at the tide gauges, the first six years of the satellite record marginally overestimates the sea-level trend. Our revised estimate of global mean sea-level rise for the satellite era (1993 to mid-2014) is about 2.6-2.9 mm per year (the exact value depends on how we estimate land motion) – slightly less than the previous estimate of 3.2 mm per year. Satellite altimeters measure sea level by measuring the time it takes a radar pulse to make a round-trip from the satellite to the sea surface and back. NOAA/STAR Third, previous estimates of the rate of rise from satellite data that didn’t incorporate the careful comparison with coastal sea-level measurements, as we have done in our recent study, showed a slower rate of rise over the past decade relative to the one before. Our revised record is clearly different and suggests that the rate of rise has increased, consistent with other observations of the increased contributions of water and ice from Greenland and West Antarctica. Read More here Historic context Australian Academy of Science: In past warmer climates, sea level was higher than today. Sea level was between 5 metres and 10 metres above current levels during the last interglacial period (129,000 to 116,000 years ago) when global average surface temperatures were less than 2°C above their values just before the start of the industrial era in the 19th century. The estimated contributions from ocean thermal expansion and a then smaller Greenland Ice Sheet imply a contribution also from Antarctica to this higher sea level. Globally, sea levels are currently rising. For two thousand years before the mid-19th century, the long-term global sea-level change was small, only a few centimetres per century. Since then, the rate of rise has increased substantially; from 1900 to 2012, sea level rose by a global average of about 19 centimetres. In the past 20 years, both satellite and coastal sea-level data indicate that the rate of rise has increased to about 3 centimetres per decade. A similarly high rate was experienced in the 1920 to 1950 period. Australian sea levels are rising. Around the Australian coastline, sea level rose relative to the land throughout the 20th century, with a faster rate (partly as a result of natural climate variability) since 1993. This follows several thousand years when there was a slow fall of Australian sea levels relative to the land at rates of a few centimetres per century. This was a result of ongoing changes to the ‘solid’ Earth following loss of the large surface loading from ice sheets of the last ice age. Read More here The cost of coastal flooding 2014, Climate Council Report: Counting the Costs: Climate Change and Coastal Flooding. Australia is largely a coastal country. Much of our population lives on or near the coast, and our six state capital cities —Sydney, Melbourne, Brisbane, Perth, Adelaide and Hobart, as well as Darwin in the Northern Territory—are all port cities. In addition to the many lifestyle amenities from living on the coast, much of the nation’s critical infrastructure—transport, commercial, residential, defence—is located along our coastlines. Virtually all of this infrastructure has been designed and built for a stable climate with known ranges of variability. But the climate system is no longer stable. Sea levels are rising and so are the risks they pose for our coastal infrastructure. This report explores two of the most serious consequences of rising sea level—the large increase in the frequency of coastal inundation and the recession of ‘soft’ shorelines. Damage caused by increased coastal inundation and recession poses a massive financial burden due to damage and destruction of infrastructure. Coastal inundation and recession also have important implications for health and well-being, coastal ecosystems and communities. Climate change exacerbates the effects of a storm surge increasing the base sea level For a sea-level rise of only 0.5 m, flood events that today might be expected once every hundred years could occur every few months in the future. Climate change is ultimately an ethical, moral, equity and intergenerational issue. Nevertheless, the economic risks from climate impacts are also important and often neglected in the public discourse. Much more reliable information on the rising economic costs of climate change impacts and risks, and a better understanding of how to adaptively plan for the future under uncertainty, are essential for informed decision-making. The bottom line is clear. The enormous risks of sea-level rise, both in the short and long terms, can be ultimately managed only by stabilising the climate system. This requires that greenhouse gas emissions are reduced deeply and quickly, and that the transition to a carbon-free global economy is achieved this century, the sooner the better. This is the critical decade for action. Now is the time to get on with the job. Read Full Report here A warming ocean is not just about temperature – acidification of our our oceans WHY IT’S IMPORTANT: The current rate in acidity change is about 50 times faster than any known historical change, making it difficult for marine life to adapt. Carbonate ions in the ocean become less abundant in a more acidic ocean, making it difficult for shellfish (clams, oysters, mussels) to build shells and skeletons. Additionally plankton, which form the base of the oceanic food web, also have trouble adapting. In a cascading effect, this will alter ecosystems in a way that could threaten seafood staples around the world. More than 1 billion people rely on oceans for food, as well as their livelihood. By one estimate, ocean acidification will cost the global economy $1 trillion annually by 2100. Corals are similarly threatened. With less calcium carbonate available, it hinders the ability for corals to maintain their reefs, which are important habitats for other marine organisms and provide some coastal protection from storms. Source: WXshift (Weather Shift) 24 March 2017, Climate News Network, World’s reefs damaged beyond repair. Australia’s Great Barrier Reef and reefs in the Maldives have been dangerously weakened by coral bleaching caused by global warming and El Niño events. The Great Barrier Reef, one of the wonders of the Pacific Ocean, may never fully recover from the combined effects of global warming and an El Niño year, according to a new study in one of the world’s leading science journals. And a second study, in a second journal, warns that increased sea surface temperatures have also caused both a major die-off of corals and the collapse of reef growth rates in the Maldives, in the Indian Ocean. Corals are very sensitive to ocean temperatures, and in unusually hot years – and these have recurred naturally and cyclically since long before humans started burning coal, oil and gas, to accelerate the build-up of greenhouse gases in the atmosphere – the corals react to stress by bleaching. That is, they eject the photosynthesising algae that live with them in symbiosis, to the advantage of both creatures. Hotter oceans But the world’s oceans are becoming hotter anyway, because of global warming driven by greenhouse gas concentrations in the atmosphere. The seas are becoming ever more acidic as atmospheric carbon dioxide reacts with the water. And the periodic return of a blister of oceanic heat in the eastern Pacific called El Niño – Spanish for “The Child”, because it becomes most visible around Christmastime – has begun to put the world’s reefs at risk. The El Niño of 2015-16 triggered a massive episode of bleaching throughout the tropics. And, Australian researchers say in Nature, the bleaching continues. “We’re hoping that the next two to three weeks will cool off quickly, and this year’s bleaching won’t be anything like last year. The severity of the 2016 bleaching was off the chart,” says Terry Hughes, of Australia’s Centre of Excellence for Coral Reef Studies, at James Cook University in Queensland. “It was the third major bleaching to affect the Great Barrier Reef, following earlier heatwaves in 1998 and 2002. Now we’re gearing up to study a potential number four. Read More here November 2016, Scientific American: Biggest-Ever Coral Die-Off Reported on Australia’s Great Barrier Reef, Warm seas around Australia’s Great Barrier Reef have killed two-thirds of a 700-km (435 miles) stretch of coral in the past nine months, the worst die-off ever recorded on the World Heritage site, scientists who surveyed the reef said on Tuesday. Their finding of the die-off in the reef’s north is a major blow for tourism at reef which, according to a 2013 Deloitte Access Economics report, attracts about A$5.2 billion ($3.9 billion) in spending each year. “The coral is essentially cooked,” professor Andrew Baird, a researcher at James Cook University who was part of the reef surveys, told Reuters by telephone from Townsville in Australia’s tropical north. He said the die-off was “almost certainly” the largest ever recorded anywhere because of the size of the Barrier Reef, which at 348,000 sq km (134,400 sq miles) is the biggest coral reef in the world. Bleaching occurs when the water is too warm, forcing coral to expel living algae and causing it to calcify and turn white. Mildly bleached coral can recover if the temperature drops and the survey found this occurred in southern parts of the reef, where coral mortality was much lower. While bleaching occurs naturally, scientists are concerned that rising sea temperatures caused by global warming magnifies the damage, leaving sensitive underwater ecosystems unable to recover. Read More here And the government’s response? 6 December 2016, The Conversation. At first glance, the progress reports on the Great Barrier Reef released last week by the Australian and Queensland governments might seem impressive. The update on the Reef 2050 Plan suggests that 135 of the plan’s 151 actions are either complete or on track. The Australian government’s apparent intention in releasing five recent reports is to reassure UNESCO that the Great Barrier Reef should not be listed as “World Heritage in Danger” (as the World Heritage Committee has previously threatened). Sadly, behind the verbosity and colour of these reports, there is disappointingly little evidence of progress in the key areas needed to make a significant difference to a World Heritage Area that is in crisis. Poor baseline The government framework for protecting and managing the Reef from 2015 to 2050, the Reef 2050 Plan, has been widely criticised as failing to provide a sound basis for the necessary long-term protection of the Reef. As well as providing a shaky basis to build effective actions, the Reef 2050 Plan has few measurable or realistic targets. It is therefore not easy to report on the actual progress. Several of the actions that will have the greatest impacts on the overall health of the Reef are shown in the progress reports as “not yet due”. In some cases, such as climate change, the Reef 2050 Plan is silent, instead simply referencing Australia’s national efforts on climate change. Read More here Prospects for the Great Barrier Reef 20 May 2015, Ove Hoegh-Guldberg, The University of Queensland Coal and climate change: a death sentence for the Great Barrier Reef. This article is the first in our series examining in depth the various threats to the Great Barrier Reef. Back in 1999, I made an upsetting discovery. By comparing the temperature tolerance of reef-building corals with the projected effects of rising carbon dioxide levels, I found that the oceans would soon grow too warm for corals to bear, meaning that coral-dominated systems like the Great Barrier Reef would disappear within 30-40 years. Much as I tried to find a mistake in my reasoning and calculations, the numbers kept telling me that one of the world’s most diverse ecosystems would disappear in my lifetime. As my study drew active discussion and debate, I desperately hoped that it was wrong and that the world had more time to solve the problem of climate change. Now, 16 years later, my conclusions have been confirmed and the message, if anything, have become even more pessimistic. Sea surface temperatures have increased rapidly by 0.85C from 1880 to 2012. In tropical regions, these changes have driven the destabilisation of the ancient symbiosis between corals and the brown micro-algae (dinoflagellates) that live inside them – a relationship that has driven the success of coral reefs for hundreds of millions of years. As temperatures rise, the dinoflagellates are damaged and are discarded, causing bleaching and leaving corals at increased risk of starvation, disease, and death. Meanwhile, ocean waters are acidifying at a rate that is unparallelled in at least the past 65 million years, potentially hampering the ability of coral reefs to maintain themselves through the all-important process of calcification. The consequences of these changes threaten to ripple up through one of the most complex ecosystems on the planet, affecting thousands of organisms from sponges to seabirds. In the process, they reduce the reef’s resilience to destructive events such as cyclones and non-climate-related human activities, fundamentally altering the food web and affecting opportunities for humans and industry. Threat to the reef… and our hip pockets It is important to appreciate that these concerns are not the mutterings of a few scientists. The threat of climate change to coral reefs like the Great Barrier Reef is part of a major scientific consensus set out by the Intergovernmental Panel on Climate Change (IPCC), as well as by federal government bodies such as the Great Barrier Reef Marine Park Authority (GBRMPA) and the US National Oceanic and Atmospheric Administration (NOAA). There is no credible alternative prognosis that has survived the peer-reviewed process of science. Without wanting to sound too dramatic, the realisation that coral reefs such as the Great Barrier Reef are about to be thumped by rapidly warming oceans should have had us on our feet. Even if you don’t like or understand coral reefs, the dollars should have spoken to you. If we lose Great Barrier Reef, we lose a large part of the A$5 billion to A$6 billion it earns from tourism and fisheries, and with that many of the 60,000-plus jobs that this amazing ecosystem provides to Australia. If we look after the reef and don’t destroy it for short-term gains, we stand to reap those benefits, year after year, far into the future. There is growing international concern that the World Heritage-listed Great Barrier Reef is in danger of being damaged irreparably. With 50% of the corals gone, UNESCO’s World Heritage Committee has been pressuring the Australian and Queensland governments to increase their commitment to reversing the deteriorating health of the Reef. Later this year, the committee will decide whether to add the reef to its official “in danger” list – a prospect that has already been extensively debated here on The Conversation. The situation has prompted the state and Federal governments to unveil a long-term sustainability plan for safeguarding the Great Barrier Reef until 2050, with input from reviews by the Australian Academy of Science and others. While many elements of the plan are commendable it has also been criticised for its lack of firm, measurable targets, and adequate discussion of the implications of climate change. Climate caution, or business as usual? While the Reef 2050 plan does mention climate change as the predominant threat to the reef, it fails to link the problem to Australia’s plans to grow the coal trade, and to ship coal through enlarged ports on the Queensland coast. The reef plan only mentions coal in the context of local-scale impacts such as coal dust and port development. The plan briefly mentions Australia’s intention to cut greenhouse emissions by 5% on 2000 levels by 2020. But there is no mention of the billions of tonnes (gigatonnes) of carbon dioxide that will be released when Queensland’s coal is dug up, sold, and burned by other countries. The spectre of coal ships traversing the Great Barrier Reef couldn’t be more laden with symbolism. Coal extracted from the Queensland landscape, if burned along with other fossil fuel reserves, will ensure the destruction of the Great Barrier Reef. With only 500-800 gigatonnes of carbon dioxide left in the global carbon budget, beyond which we will push the climate into a dangerous state, the emissions from even a single mine can play a significant role. The Carmichael mine in the Galilee basin, for example, will pump out 4.49 gigatonnes during its lifetime. Given that the world’s reserves of fossil fuels are estimated to be capable of generating 2,500 gigatonnes of carbon dioxide, business-as-usual is easily capable of destroying the reef (pushing the added carbon dioxide well beyond the 500-800-gigatonne budget), along with many other ecosystems too. On the other hand, the negotiations over Australia’s greenhouse emissions are clearly separate from the deliberations of the World Heritage Committee. While it is almost certainly true that continual failure to act on climate change will mean the death of the Great Barrier Reef and every other coral reef, the question of how to curb emissions is obviously best handled by the United Nations’ climate negotiations framework, which is convening this year’s crucial Paris COP21 talks. Yet one could also argue that Australia should stand up as a nation and help lead the world away from this current dangerous climate trajectory. After all, if we know that adding more carbon dioxide to the atmosphere is extremely dangerous for the Great Barrier Reef, why would Australia deliberately put such a national treasure and economic powerhouse at risk by helping dig up even more carbon to burn from the Queensland landscape? If Australia is truly committed to preserving the Great Barrier Reef, it faces a tough choice: re-examine the current plans for unrestricted coal exports, taking proper account and responsibility for the resulting greenhouse emissions, or watch the reef die. Surely we as Australians have more foresight and chutzpah than to let that happen! Ove Hoegh-Guldberg is Director, Global Change Institute at The University of Queensland. This article was originally published on The Conversation. Read the original articleThe growing loss of ice from glaciers is a well known outcome of a warming planet. This video which captures the largest glacier calving (the size of Manhattan) ever filmed
What the stats mean on the ground
23 November 2022, The Conversation: State of the climate: what Australians need to know about major new report
Key points
Climate Shift Index ™ Revealing the influence of climate change on local weather
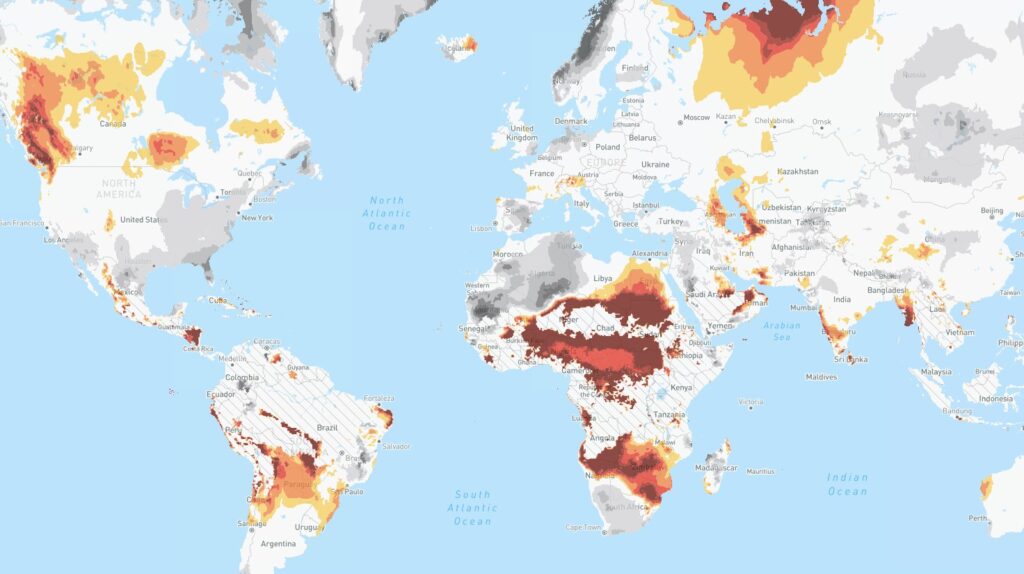
Watch La Niña fade and El Niño approach in the tropical Pacific Ocean in 2023
16 November 2022, The Conversation: Climate change will clearly disrupt El Niño and La Niña this decade – 40 years earlier than we thought.
30 September 2022, The Conversation: Shifting ocean currents are pushing more and more heat into the Southern Hemisphere’s cooler waters.
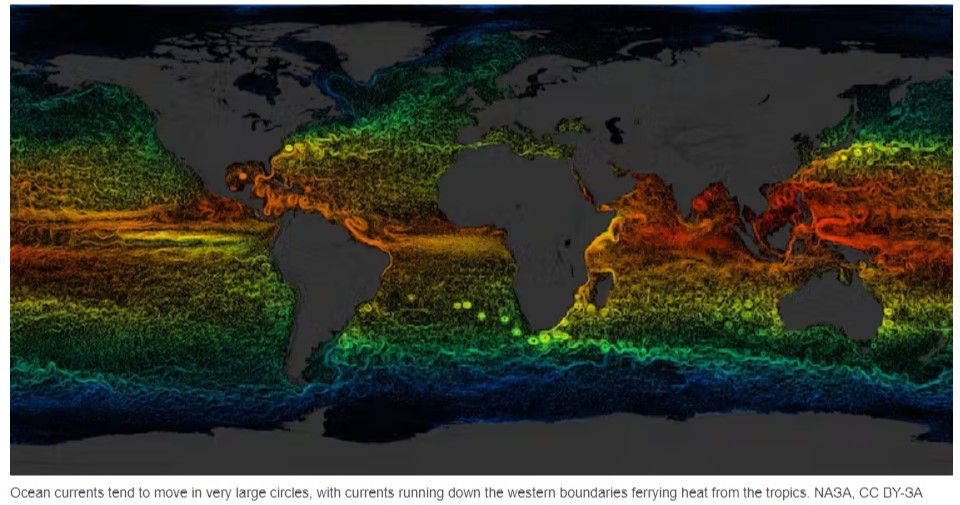
When rivers reach the sky
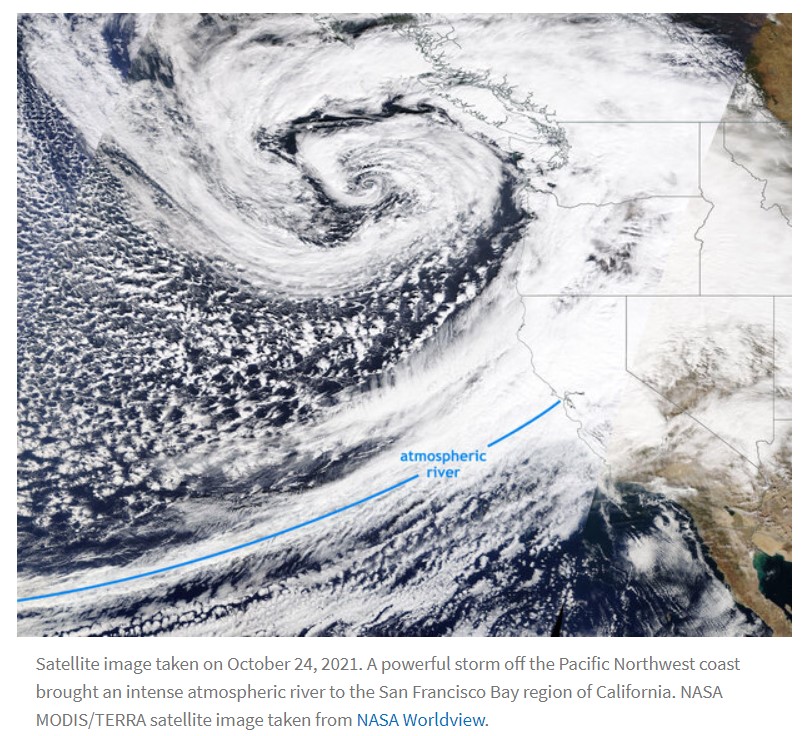 This past December, a mind-boggling 18 feet of snowfall fell in the California Sierra Nevada Mountains! How does so much snow fall in one place in such a short period of time? One of the primary phenomena responsible for such extreme rain and snowfall, particularly in regions like the western U.S., is the atmospheric river. Like their terrestrial counterparts, atmospheric rivers carry tremendous amounts of water over thousands of miles. These aerial versions, however, often bring both severe disruption and great benefit through the heavy rain and mountain snows that they produce. In this blog post, we will give you a brief primer on atmospheric rivers and (of course!) explain how they are affected by ENSO (El Niño-Southern Oscillation).
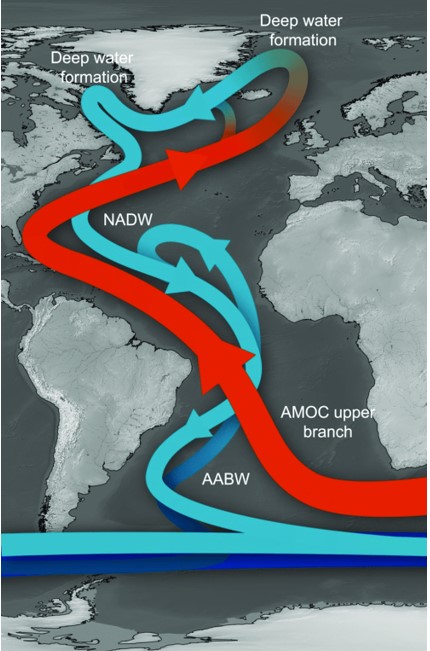
Heatwaves at both of Earth’s poles alarm climate scientists
![]()
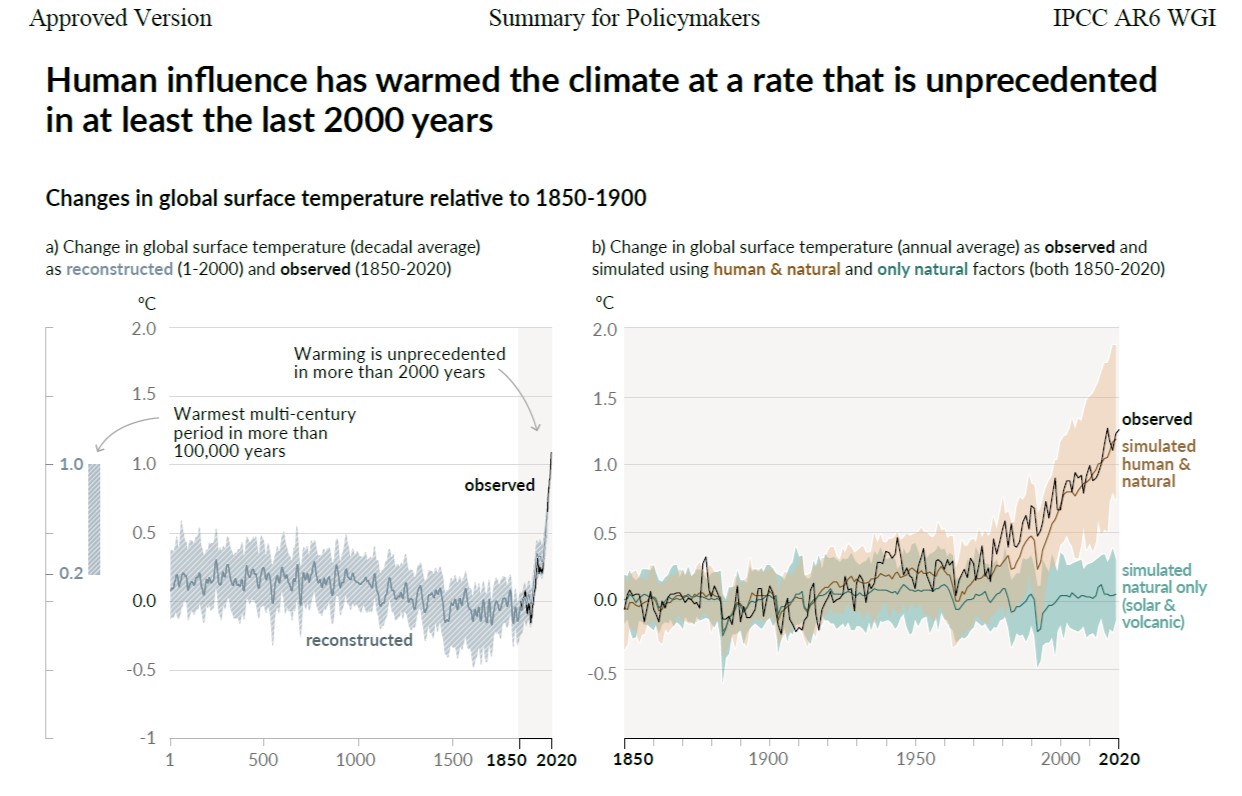
Brief periods of dangerous humid heat arrive decades early
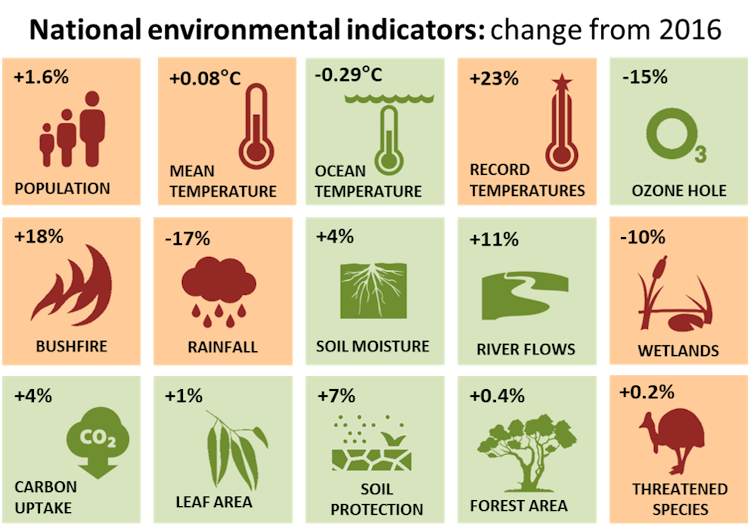
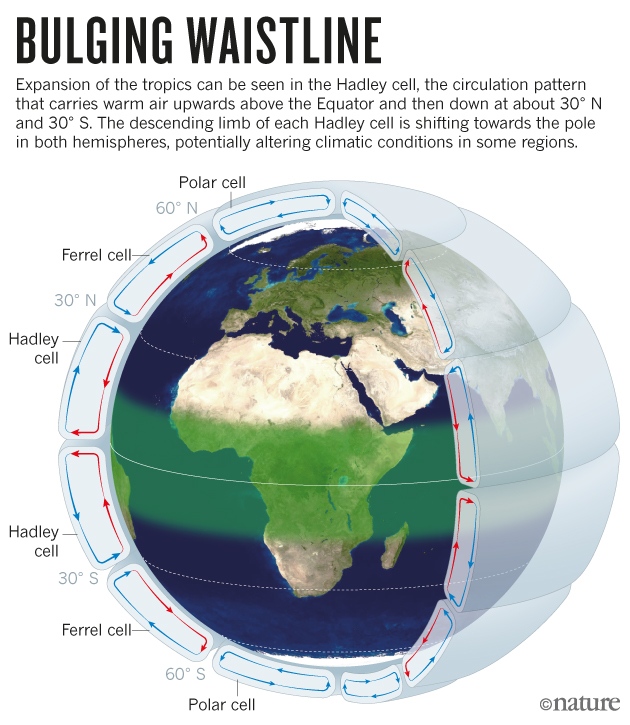 28 June 2017, The Conversation, The world’s tropical zone is expanding, and Australia should be worried. The Tropics are defined as the area of Earth where the Sun is directly overhead at least once a year — the zone between the Tropics of Cancer and Capricorn. However, tropical climates occur within a larger area about 30 degrees either side of the Equator. Earth’s dry subtropical zones lie adjacent to this broad region. It is here that we find the great warm deserts of the world.Earth’s bulging waistline Earth’s tropical atmosphere is growing in all directions, leading one commentator to cleverly call this Earth’s “bulging waistline”. Since 1979, the planet’s waistline been expanding poleward by 56km to 111km per decade in both hemispheres. Future climate projections suggest this expansion is likely to continue, driven largely by human activities – most notably emissions of greenhouse gases and black carbon, as well as warming in the lower atmosphere and the oceans. If the current rate continues, by 2100 the edge of the new dry subtropical zone would extend from roughly Sydney to Perth. As these dry subtropical zones shift, droughts will worsen and overall less rain will fall in most warm temperate regions. Poleward shifts in the average tracks of tropical and extratropical cyclones are already happening. This is likely to continue as the tropics expand further. As extratropical cyclones move, they shift rain away from temperate regions that historically rely upon winter rainfalls for their agriculture and water security. Researchers have observed that, as climate zones change, animals and plants migrate to keep up. But as biodiversity and ecosystem services are threatened, species that can’t adjust to rapidly changing conditions face extinction. In some biodiversity hotspots – such as the far southwest of Australia – there are no suitable land areas (only oceans) for ecosystems and species to move into to keep pace with warming and drying trends. We are already witnessing an expansion of pests and diseases into regions that were previously climatically unsuitable. This suggests that they will attempt to follow any future poleward shifts in climate zones. Read More here
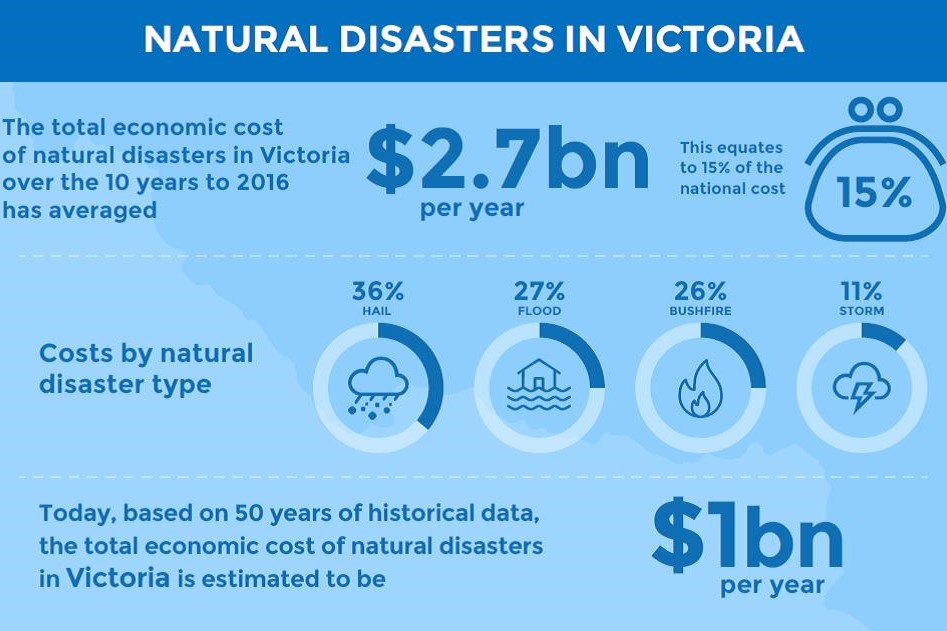
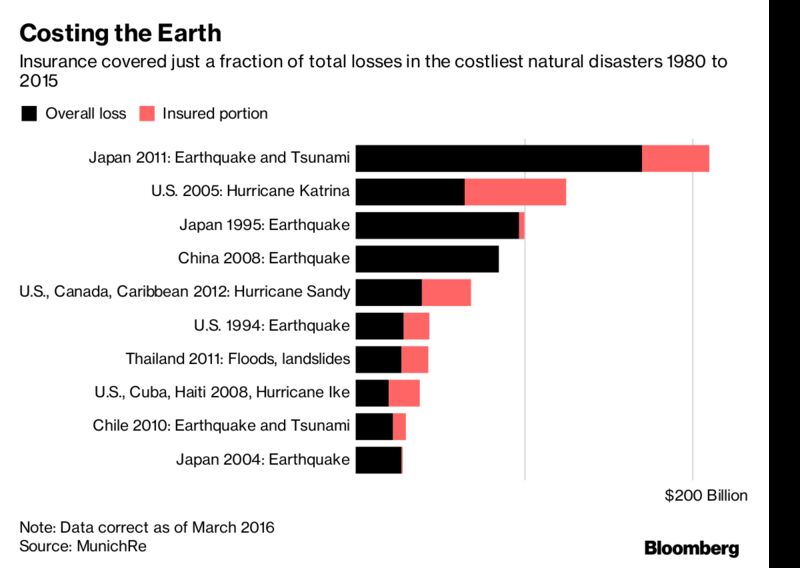 13 November 2017. Bloomberg, Big Insurers Brace for Perilous Future as Climate Risks Escalate. After one of the worst Atlantic hurricane seasons in history, the world’s biggest insurers say the industry needs to get its act together if it wants to survive climate change. Insuring against weather natural disasters could reach unaffordable levels for households and companies, while the potential damage is so unpredictable it may be impossible to model — an unacceptable risk to insurers. “Sometime in the future there will be the situation where people cannot afford any longer to buy catastrophe insurance — this is what we want to avoid,” Ernst Rauch, the head of the Corporate Climate Centre at Munich Re. The world’s largest reinsurer suffered a 1.4 billion-euro ($1.63 billion) loss after hurricanes Harvey, Irma and Maria sent claims soaring. Contrary to Warren Buffett’s view that climate change will spur demand for coverage and boost profit at his insurance companies, the risk is the opposite unfolds as shifting weather patterns render disaster-prone areas uninsurable. Finding ways to prevent this is on the agenda of United Nations-backed climate talks in Bonn, Germany this week. The onus of bearing the expense of rebuilding after hurricanes, floods and earthquakes already falls disproportionately on governments. Insurers are on the hook for only about 10 percent of $75 billion of damage in Texas caused by flooding after Hurricane Harvey, according to AIR Worldwide. That’s because most standard U.S. home insurance policies don’t cover flooding. It’s a similar story in Fiji, hit last year by its worst cyclone ever, where less than one in ten people own insurance. “It’s a big concern of Swiss Re that there’s such a huge gap between the economic losses and what is insured,” said Peter Zimmerli, the head of atmospheric perils at Swiss Re, the second-biggest reinsurer. “Some of the signals of global warming are just there — they can’t be debated any more.” Read More here
There goes the neighbourhood! Climate change, Australian housing and the financial sector
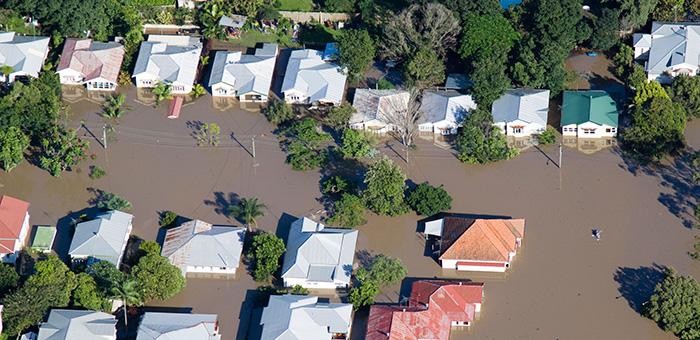 May 2016, The Climate Institute: Housing in Australia The role of housing in Australia goes far beyond providing shelter and security. For a majority of people, a home is their biggest financial asset – or liability. Housing serves as a source of income through capital growth, rental returns and tax minimisation. It is collateral for most mortgages and many small business loans.1 The housing sector directly or indirectly drives nearly a third of the economy (see Figure 1), and mortgages account for about 60 per cent of the big four banks’ assets.2 Consequently, housing concerns a diverse group of stakeholders – individuals (owners, residents and investors), banks, insurers, local governments, state governments and the federal government……
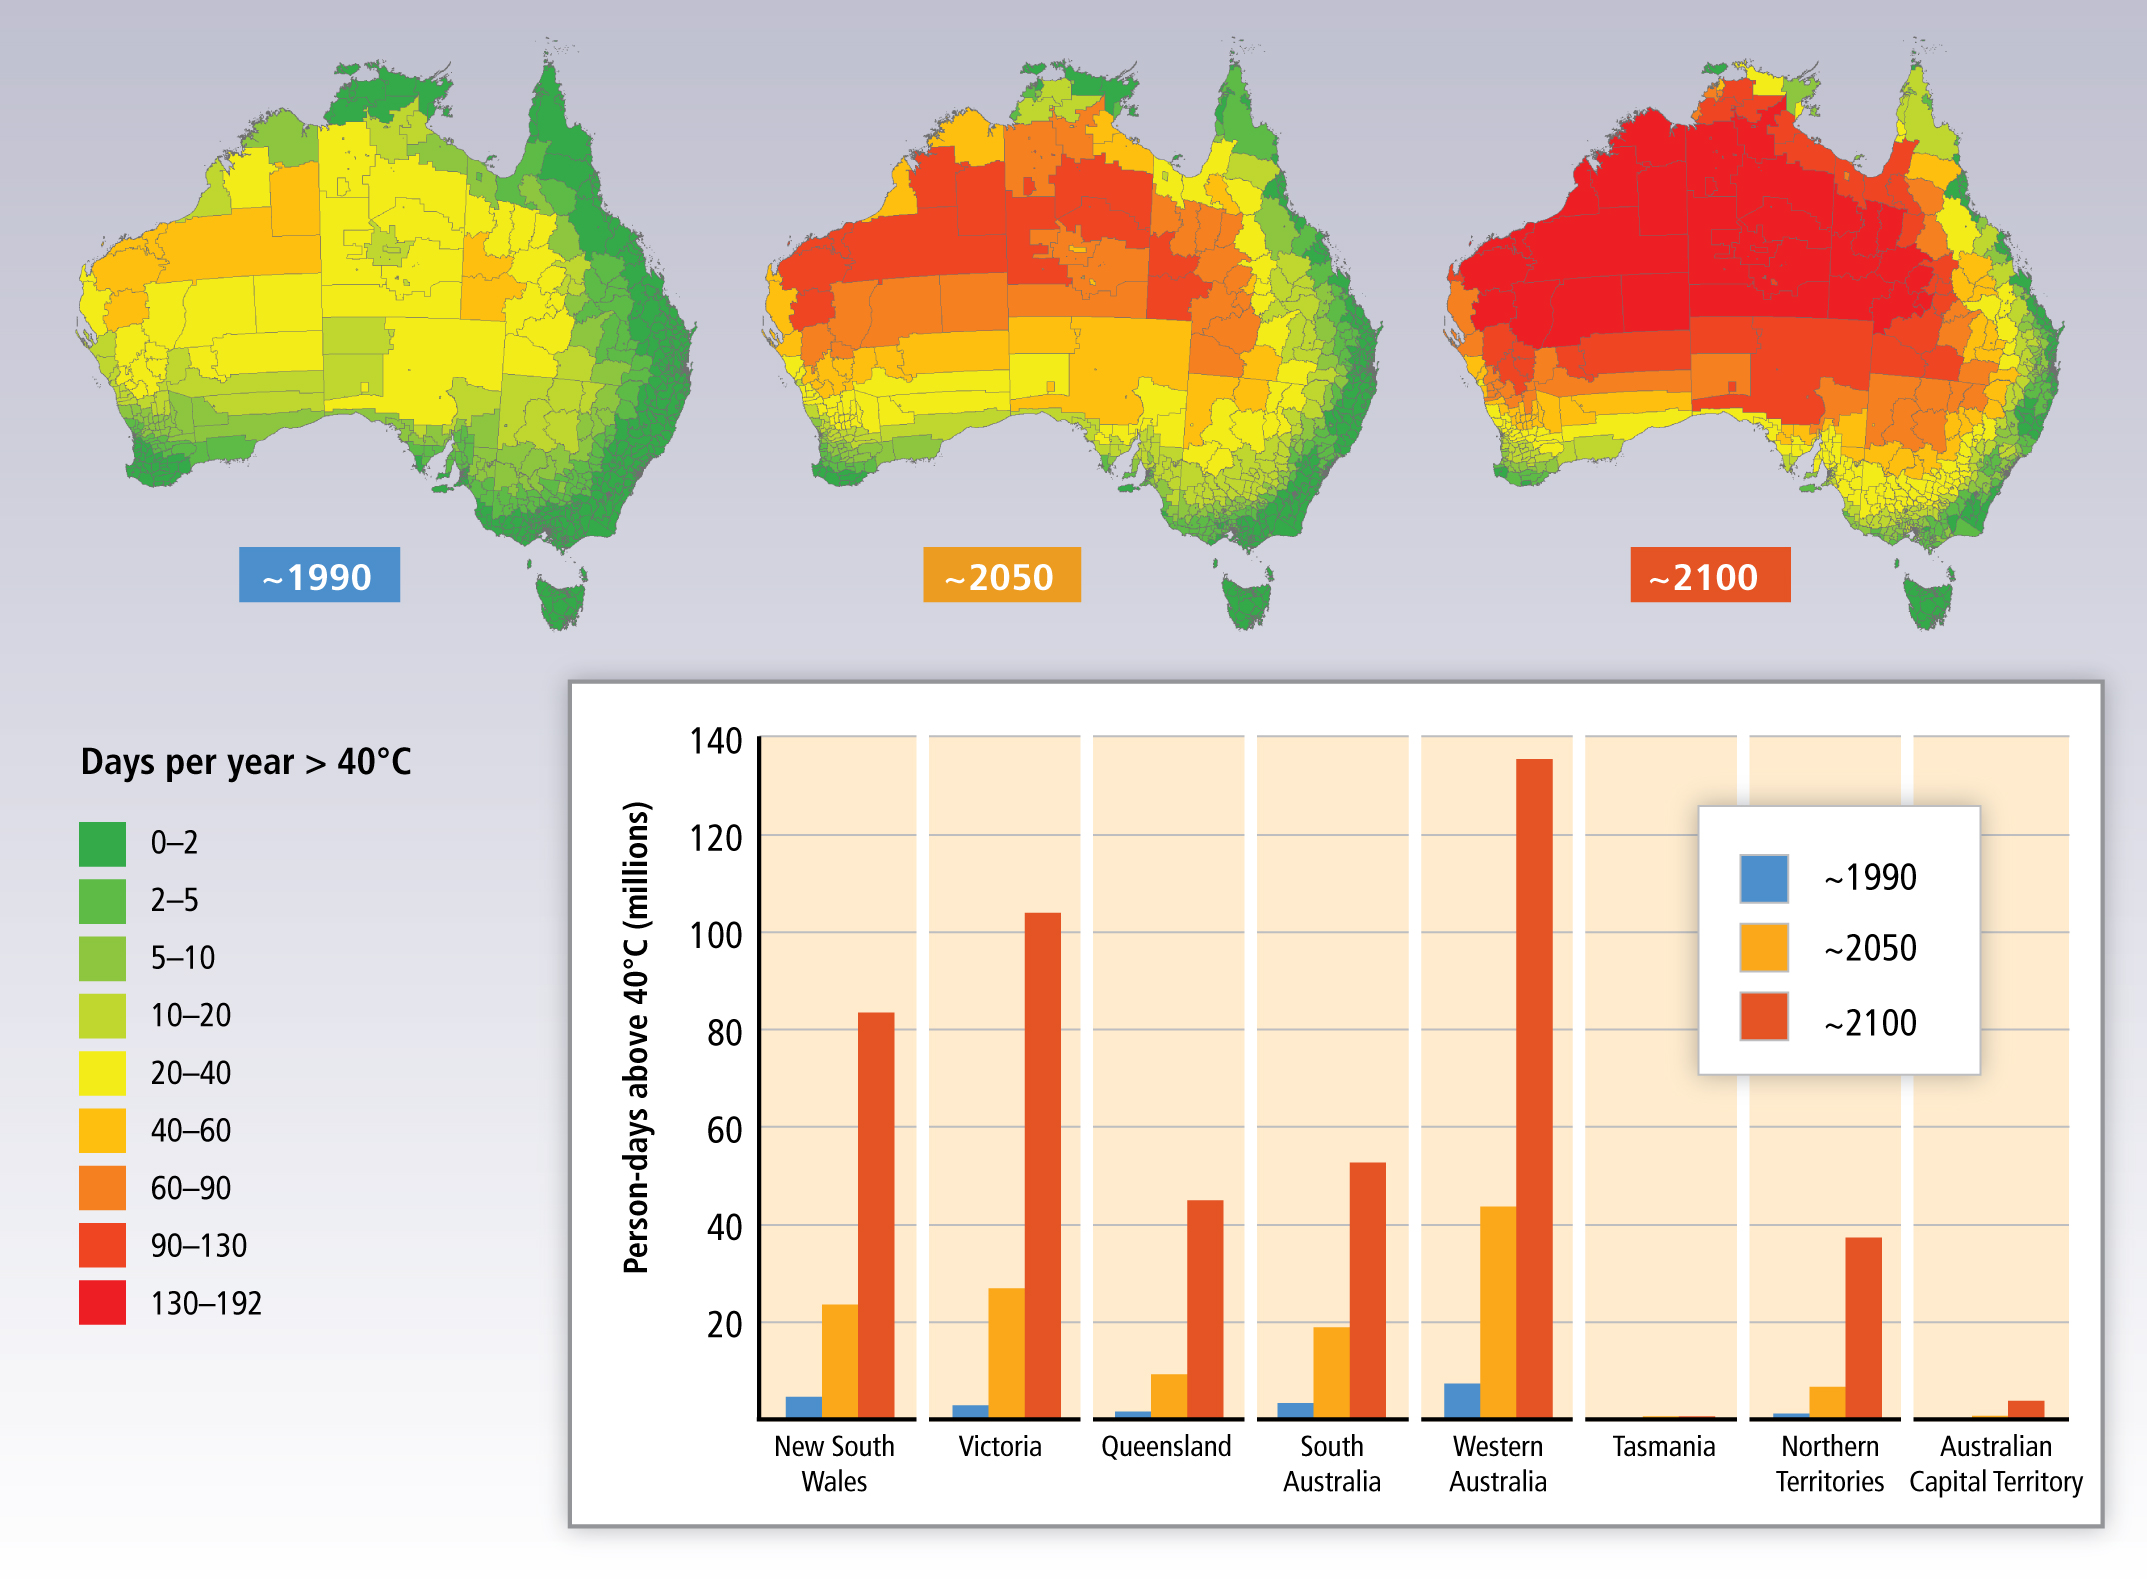
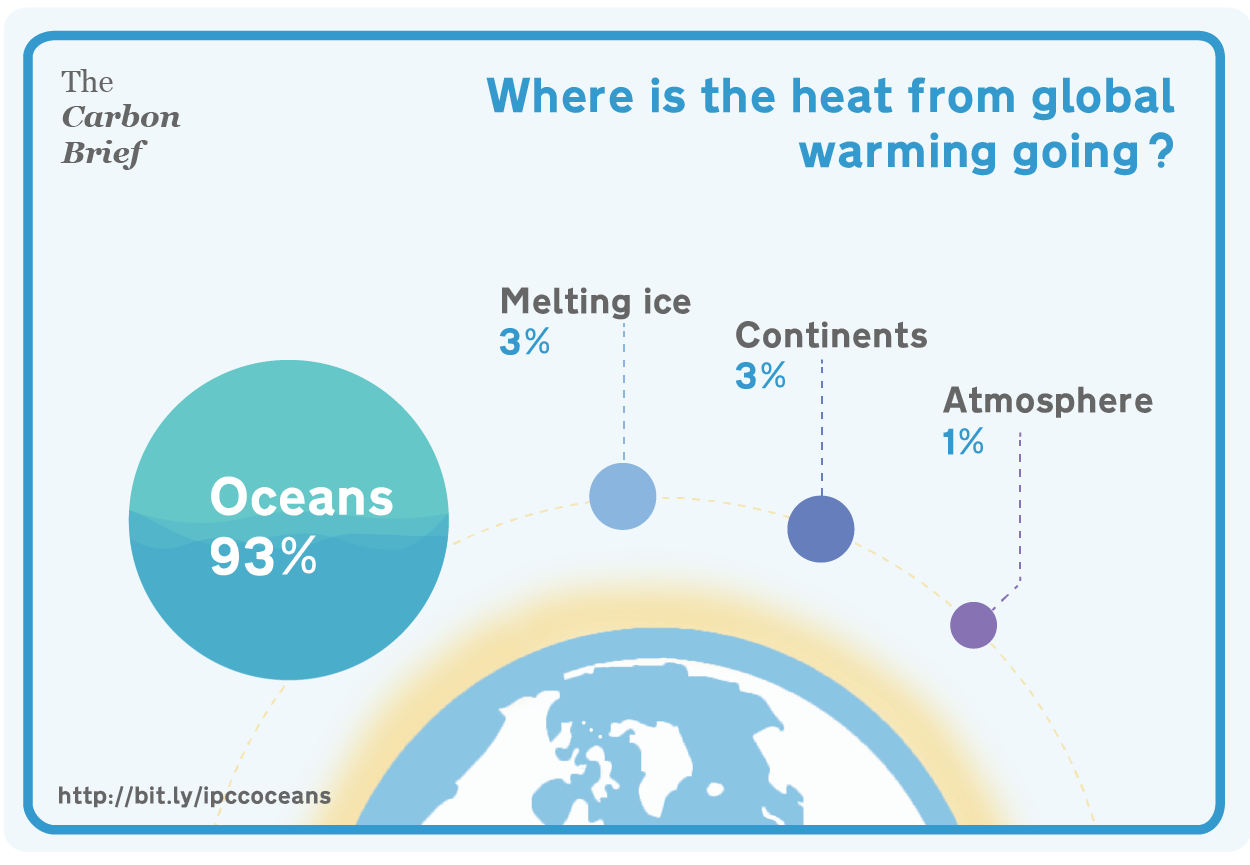
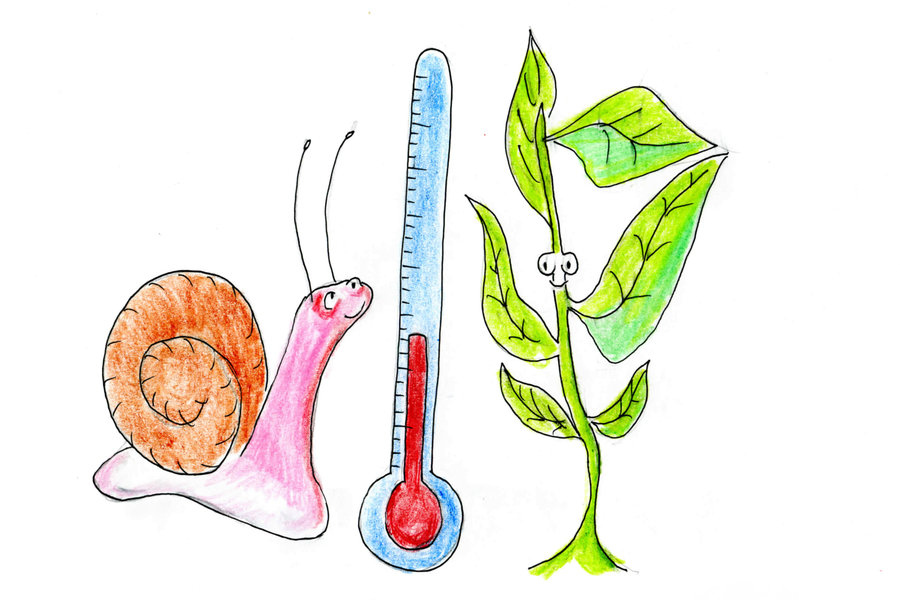 But then, gradually, over the years, it gets warmer. Not every day, of course, but on more and more days, the temperature climbs to uncomfortable highs, drying you out, making you tired, thirsty.
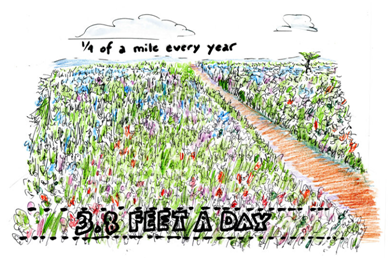
 To get a little cooler, all you have to do is climb a small distance. But to get a degree or two cooler on flatter land (on the plains, grasslands, in a rural area), you may need to travel a half mile or more every year to keep your climate constant. For a beetle, a snail, that’s a hike. And if there are highways, fences, shopping malls in your way, the trip may be impossible.
 That’s going to be a problem. Picture a whole lot of animals (and plants) moving north (or south), trying to stay cool, until eventually they come to the edge of their Canadian, African, Russian or American national park, which is bordered by hotels, motels, car parks, guide centers, roads, power lines.
Extreme Events
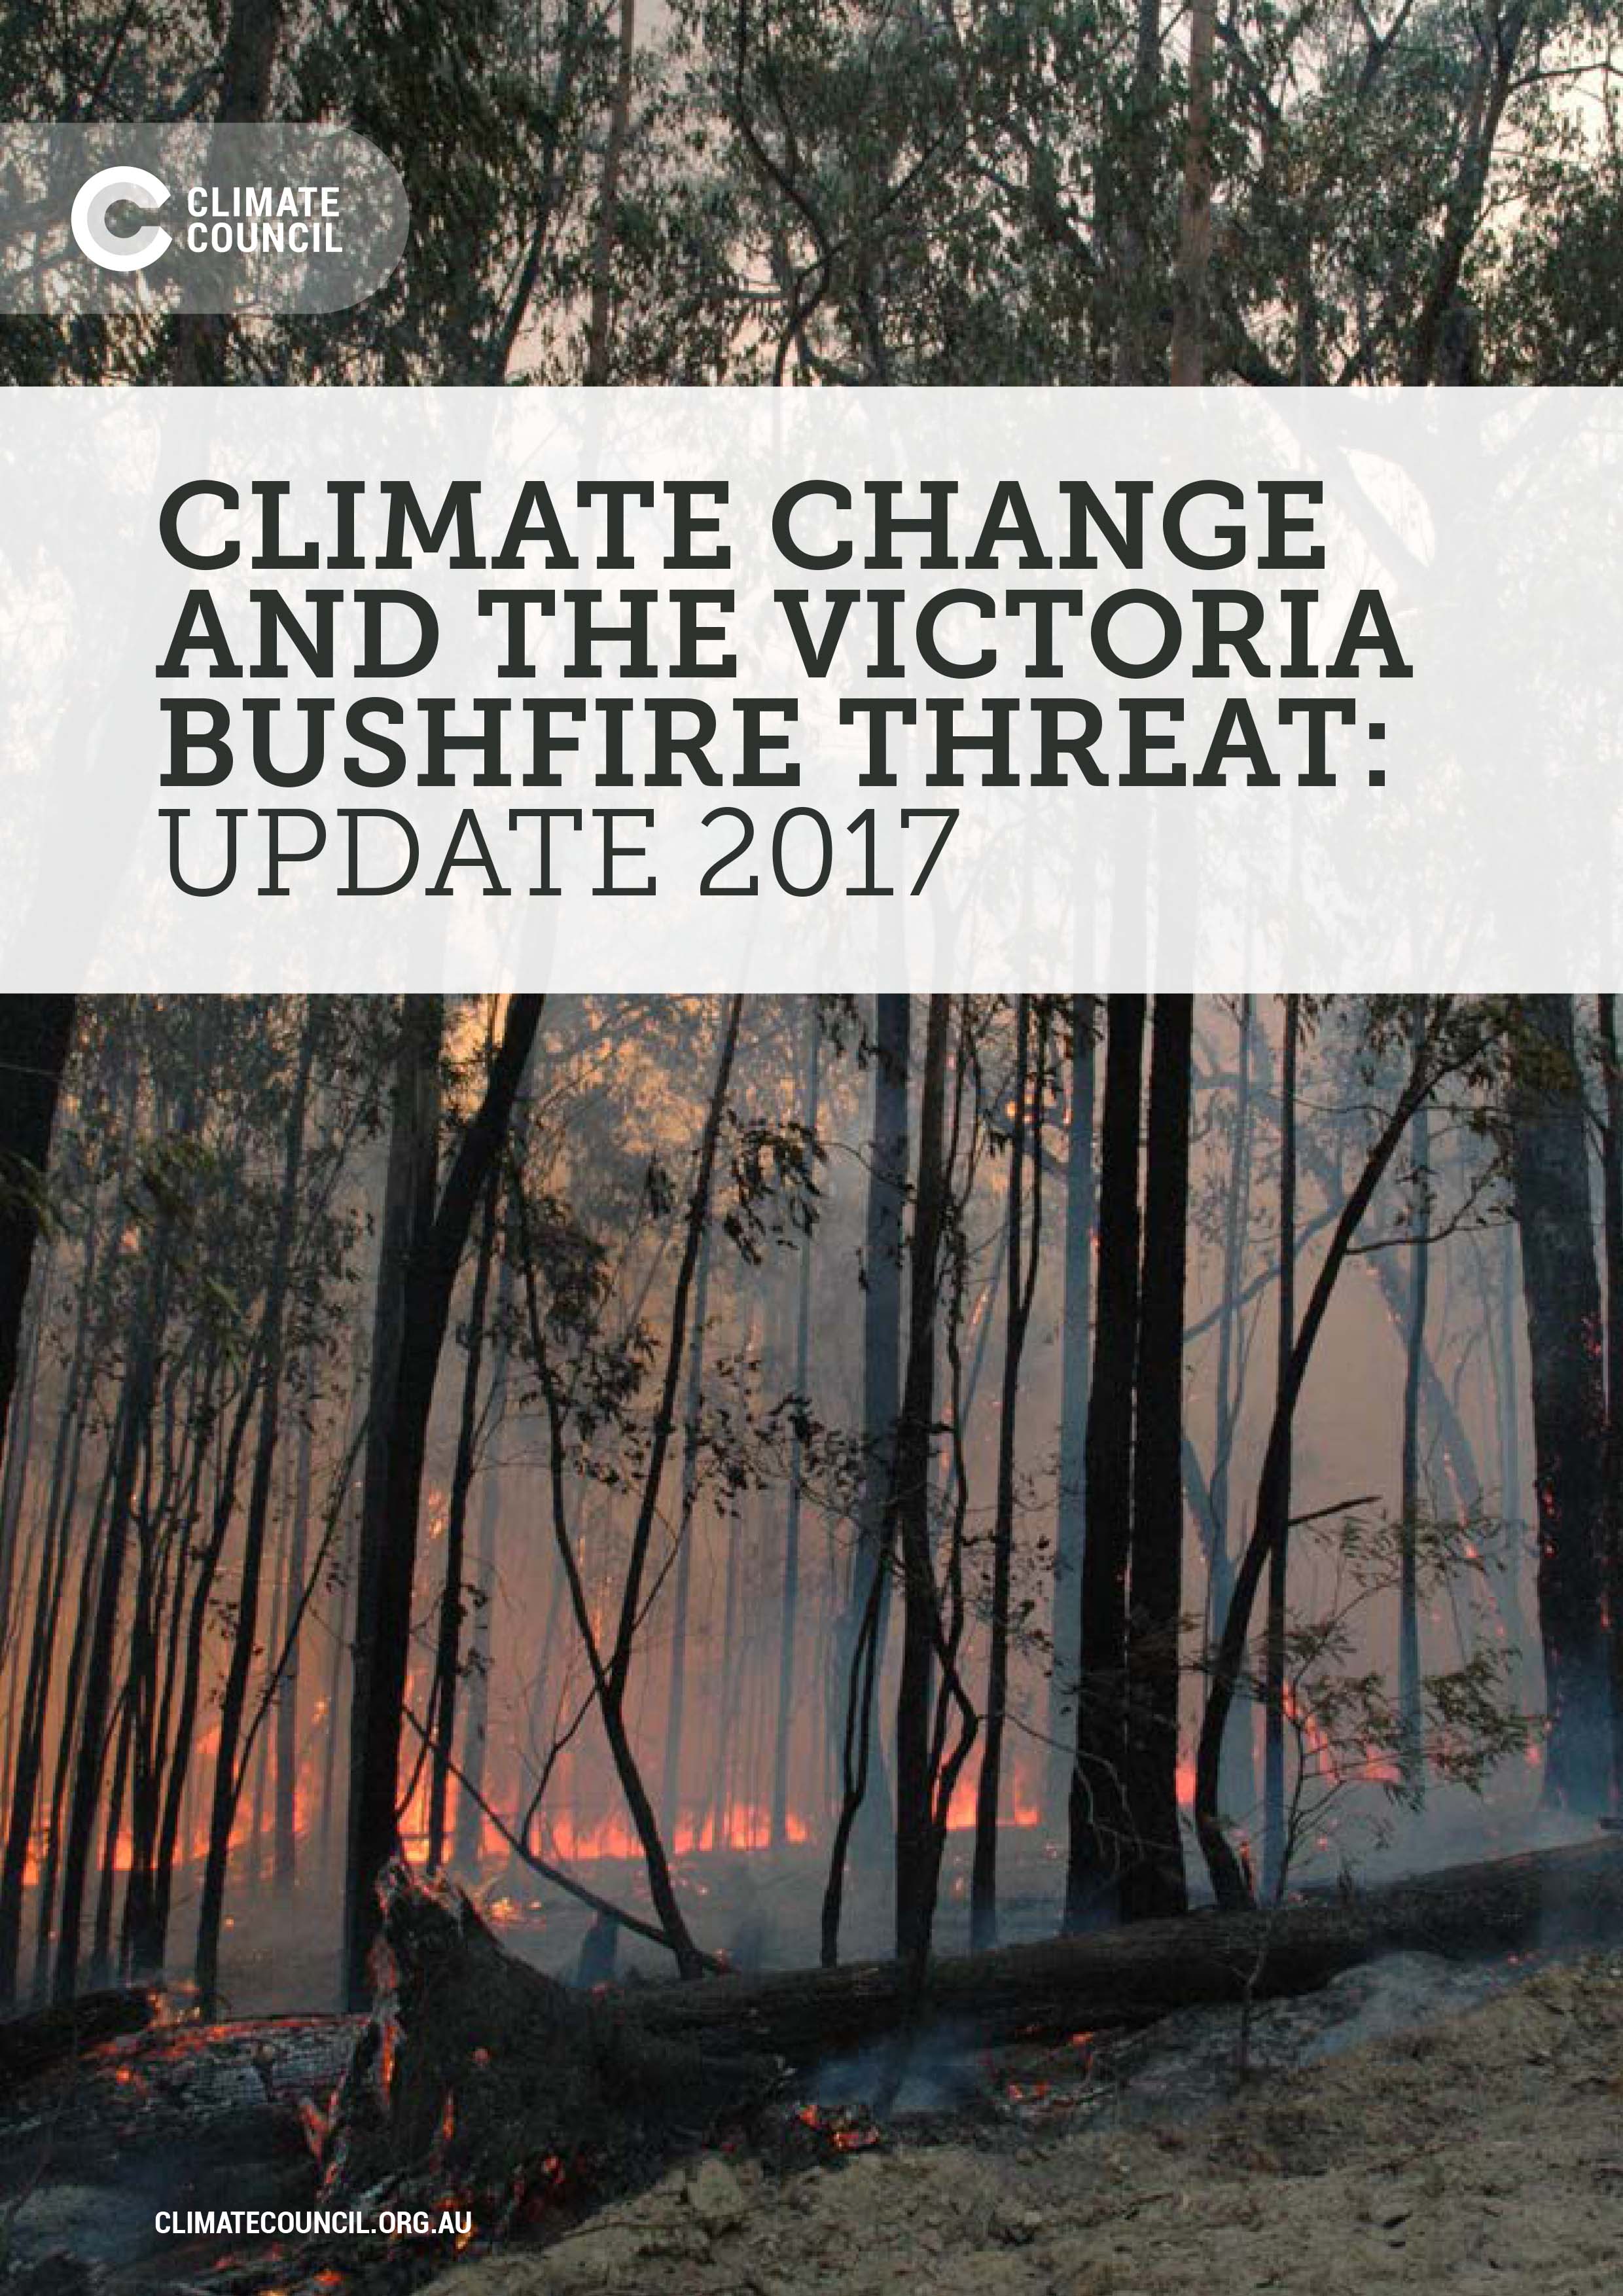 18 January 2017, Climate Council Report: Victoria is on the brink of an extreme bushfire season as climate change continues to intensify bushfire risk, our new report reveals. The economic toll of Victoria’s bushfires is projected to more than double by 2050, with the state bearing the brunt of Australia’s economic losses from bushfires, the report finds. Access report here
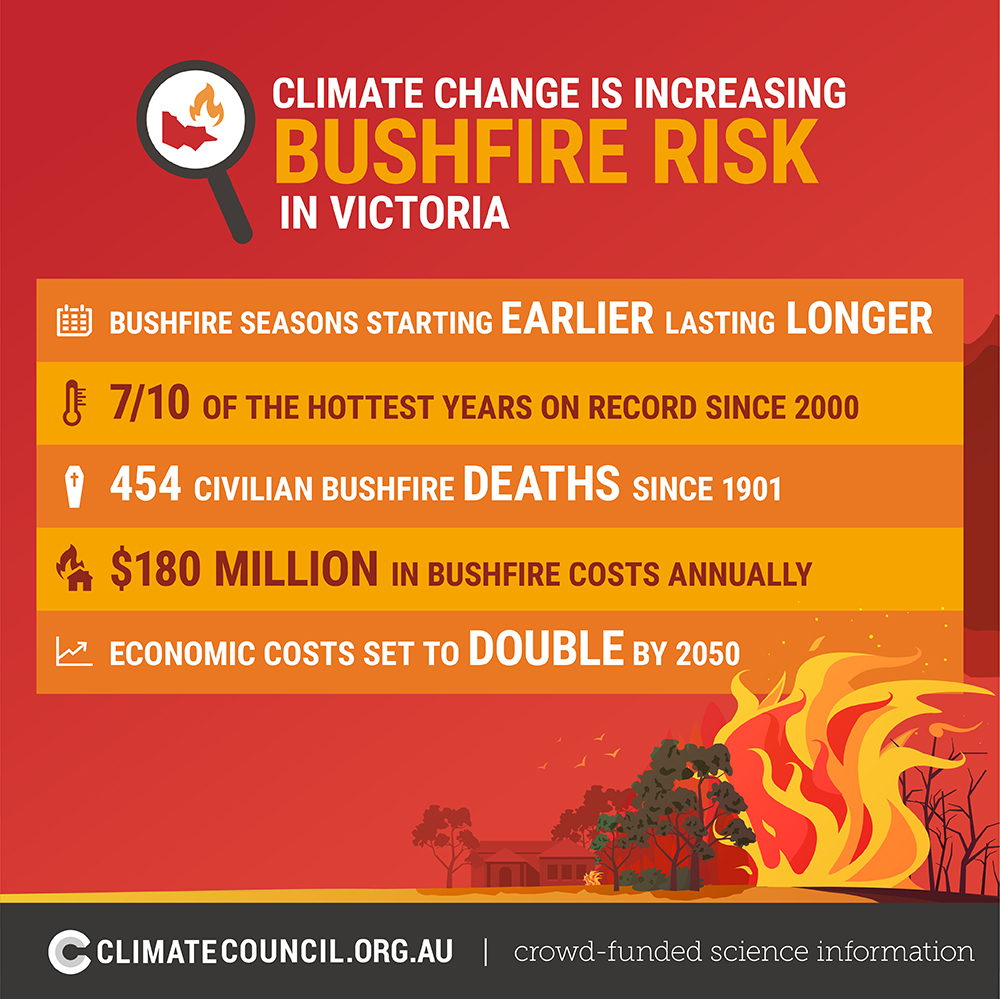 Key Findings:
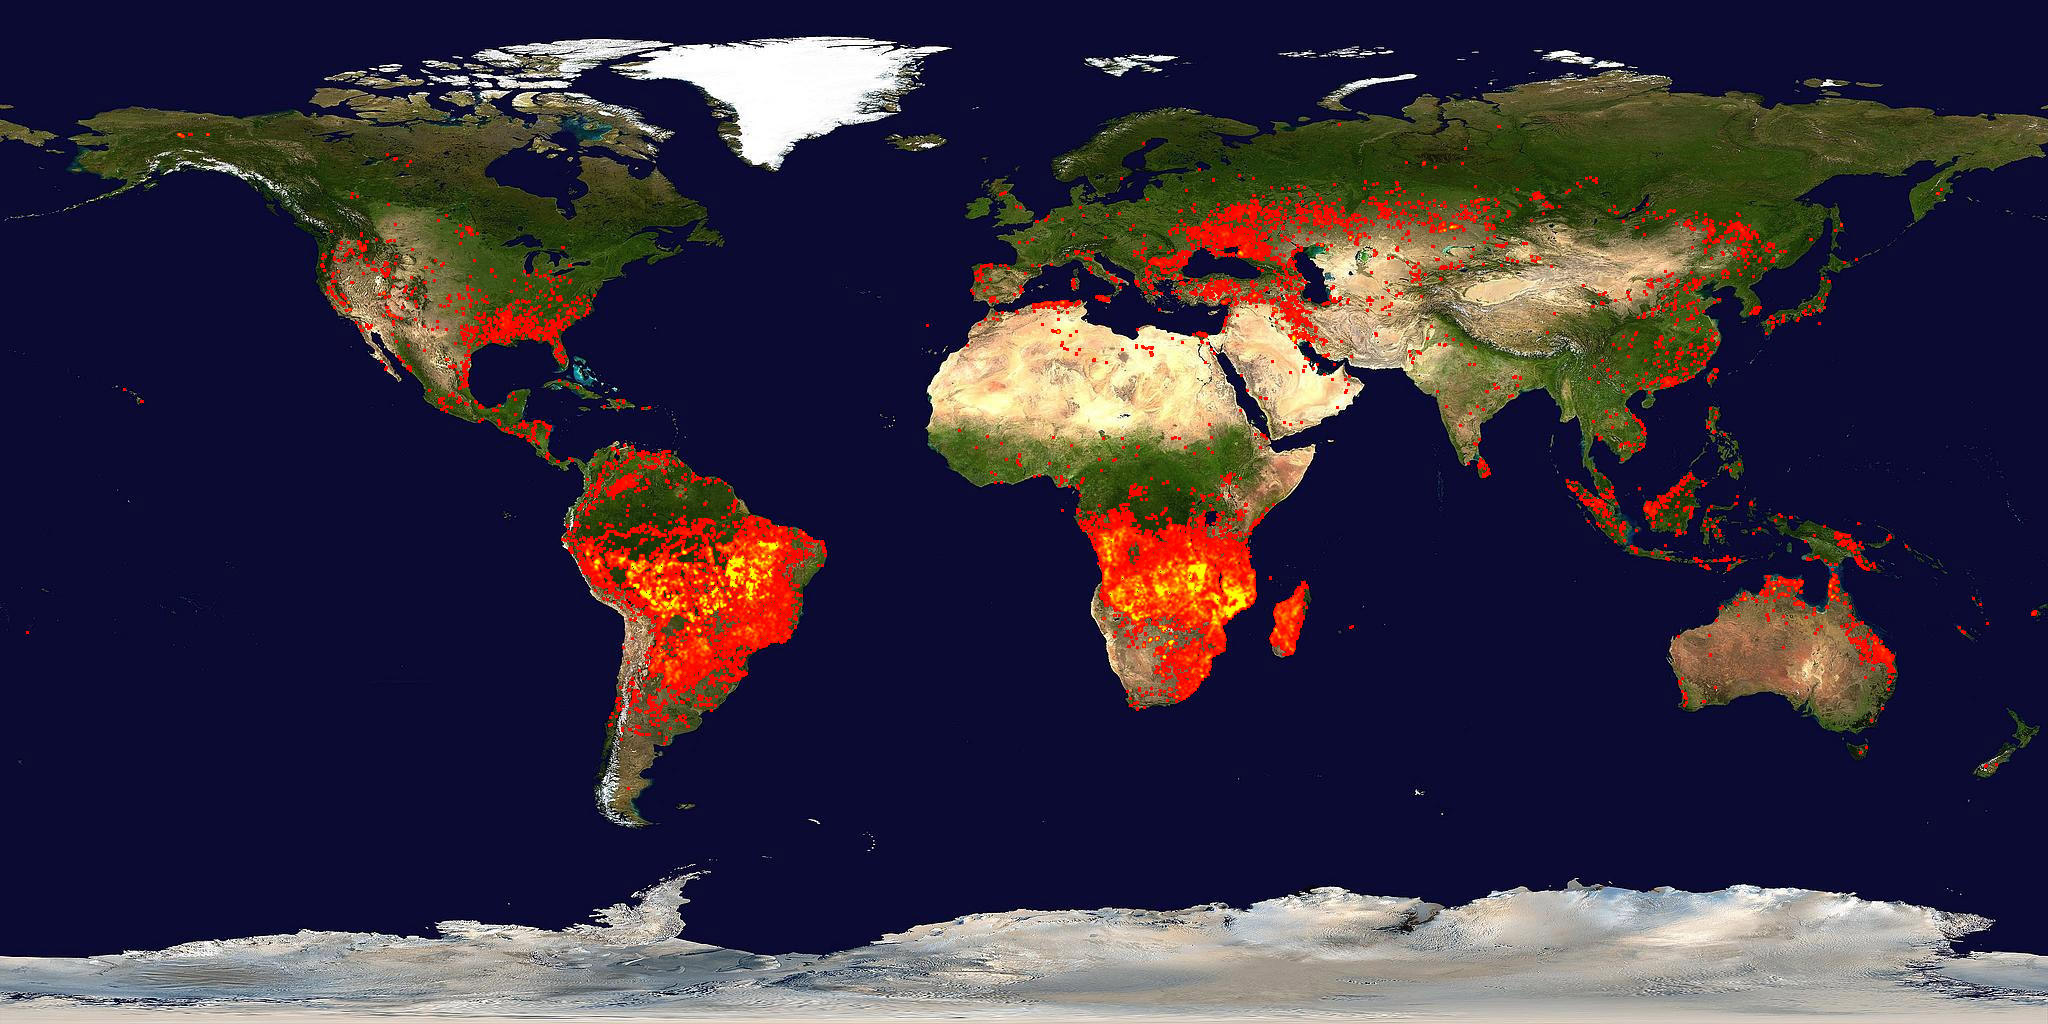 And research suggests that a hotter Earth resulting from global warming will lead to more frequent and larger fires. The fires release “particulates” — tiny particles that become airborne — and greenhouse gases that warm the planet. The Moderate Resolution Imaging Spectroradiometer (MODIS) on NASA’s Terra satellite shows fires around the world. Credit and source: NASA
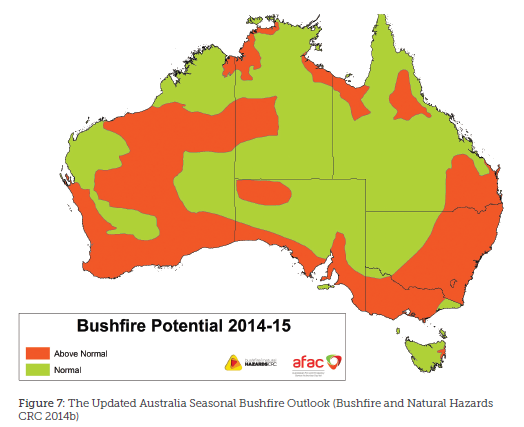
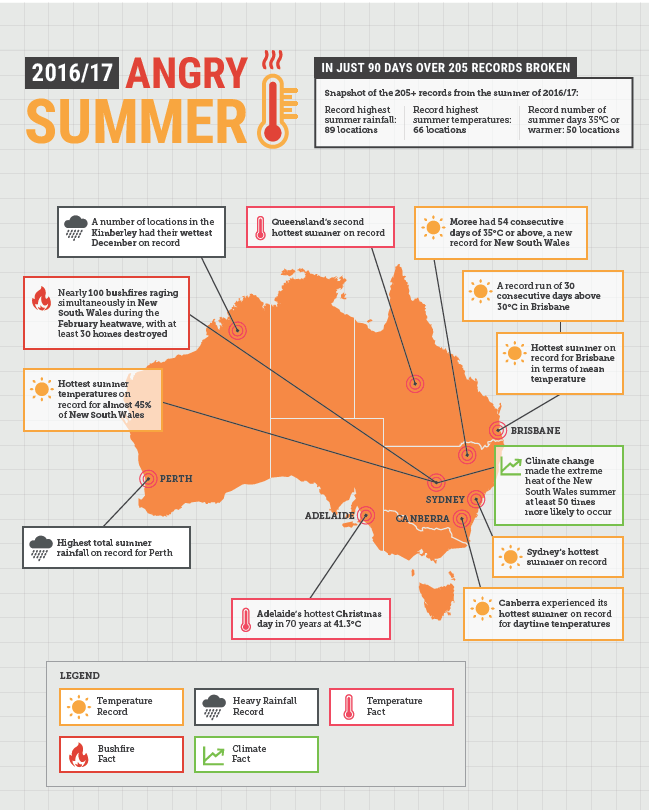
 KEY FINDINGS
2. Climate change is driving hotter, longer lasting and more frequent heatwaves.
3. Escalating extreme weather is putting Australia’s ageing energy system under intense pressure.
 12 December 2017, Climate Council: The Climate Council today released an urgent factsheet to highlight the significance of the high-impact extreme weather event, with more than triple the amount of Victoria’s average monthly rainfall expected to fall across the weekend, in what has been labelled by the Bureau of Meteorology as ‘unchartered territory’. With worsening thunderstorms, severe rainfall and flash flooding expected to continue hitting Southeast Australia across the weekend, this briefing paper describes the influence of climate change on extreme rainfall. Access fact sheet here
 6 September 2017, Climate Central, Climate change intersects with hurricanes by increasing storm rainfall, intensity, and surge. A warming atmosphere causes more evaporation, meaning more water is available for precipitation. For every 1°F increase in temperature, the atmosphere can hold around 4 percent more water vapor, which leads to heavier rain and increases the risk of flooding of rivers and streams. We saw the impact of extreme rainfall during Harvey. Though no research has yet been done to attribute the staggering rainfall totals from this storm to climate change, the downpours are very much in line with heavy precipitation trends. Read More here
 30 March 2017, Climate Council Fact Sheet: Tropical Cyclones and Climate Change. Cyclone Debbie, a devastating category 4 storm, ripped through north Queensland on 28 March 2017. The storm has prompted many people to ask the Climate Council about the influence of climate change on tropical cyclones. This Fact sheet provides an overview of the role that climate change is playing in influencing tropical cyclones. Future projections indicate that an increase is likely in the proportion of the most intense tropical cyclones, while the total number of tropical cyclones will likely decrease.
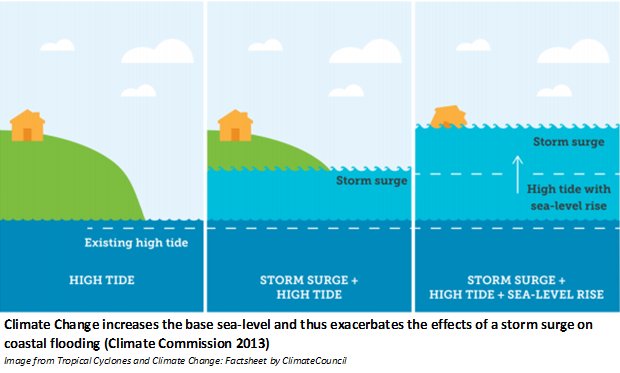
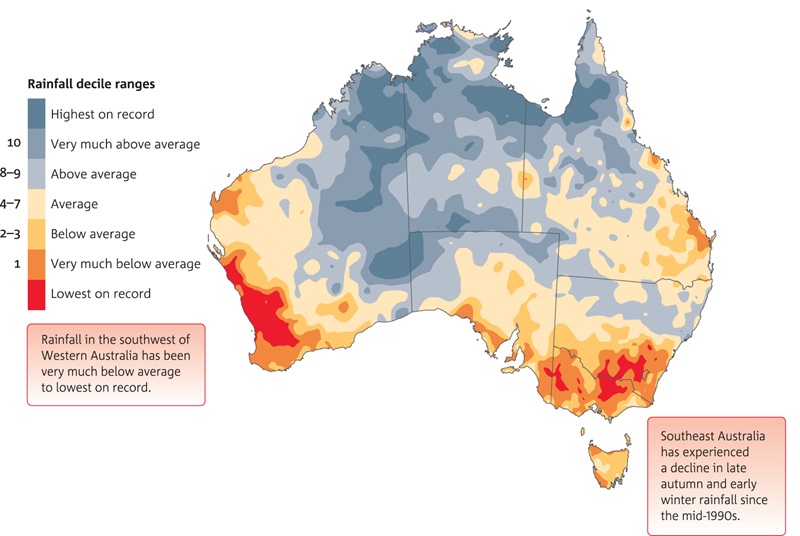
IMPACTS HAPPENING NOW
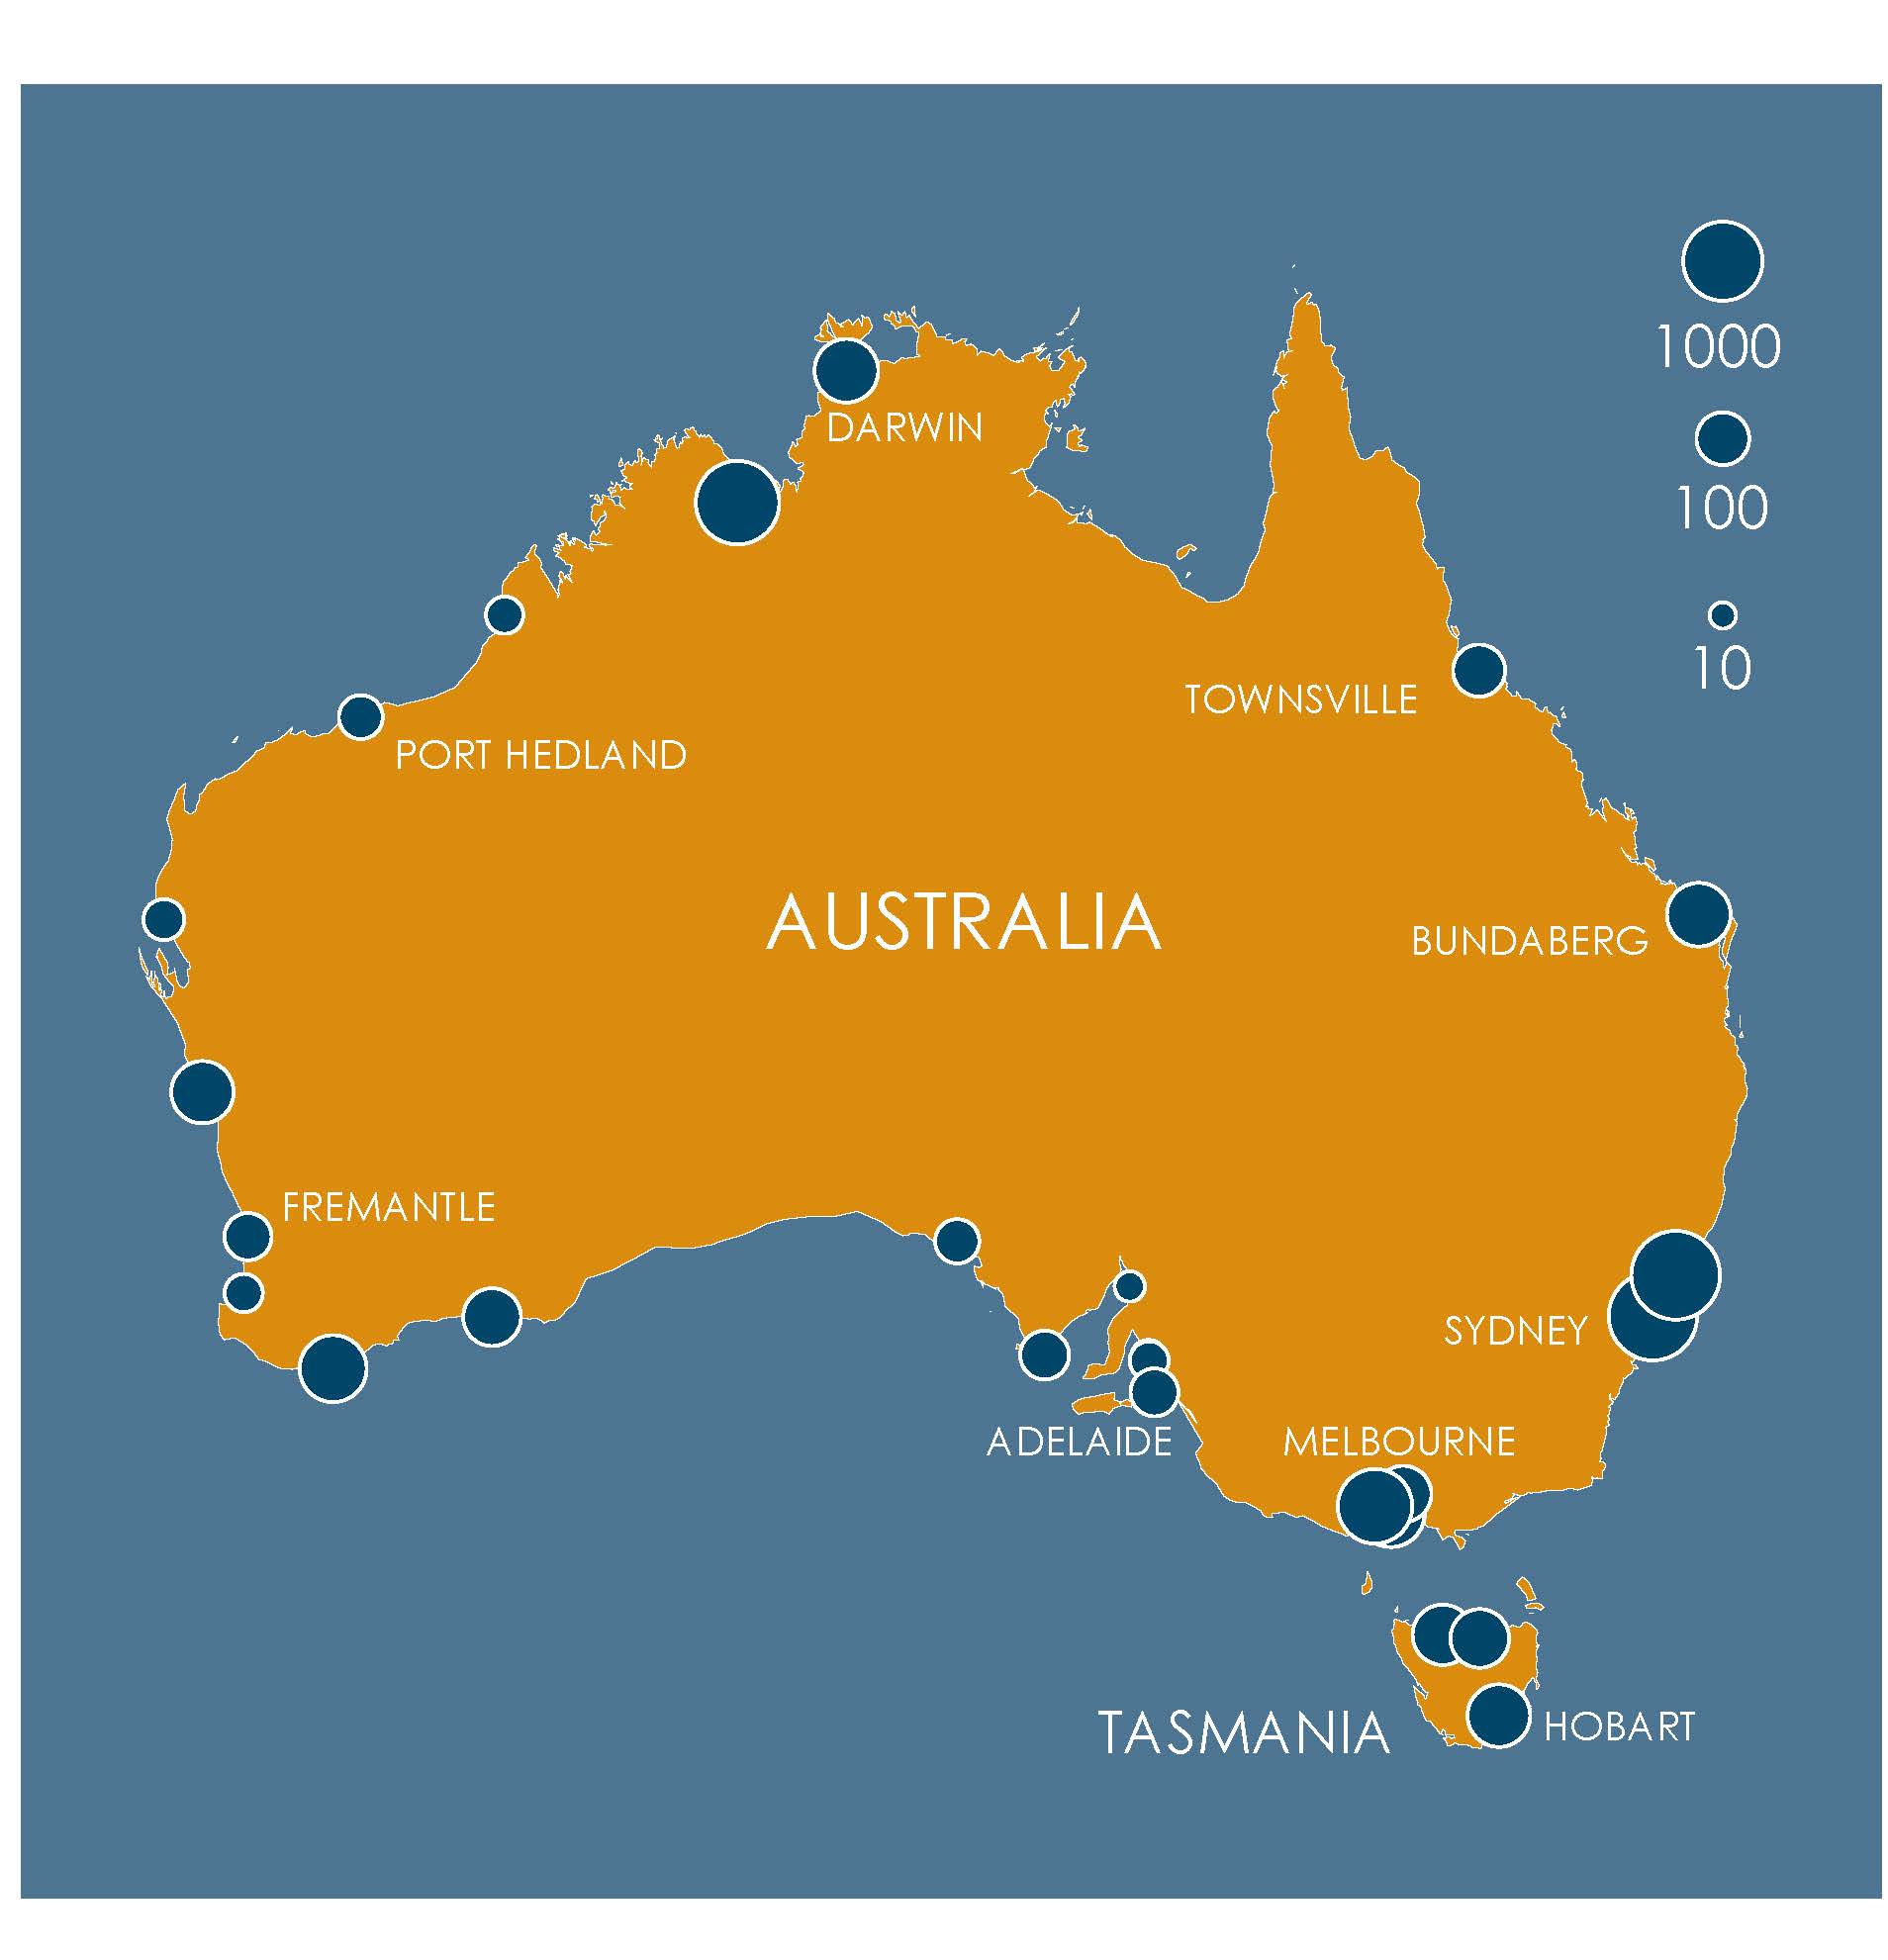 Visit also the Canute website: Canute is a sea level calculator. A test site for potential new tools is available here (also provides distribution point for underlying data). Canute provides estimates of the likelihood of flooding from the sea during this century, taking into account sea-level rise and the effects of tides and storm surges and now offers a range of additional calculators. To find out more click here.
26 August 2015, NASA, Warming seas and melting ice sheets. Sea level rise is a natural consequence of the warming of our planet. We know this from basic physics. When water heats up, it expands. So when the ocean warms, sea level rises. When ice is exposed to heat, it melts. And when ice on land melts and water runs into the ocean, sea level rises.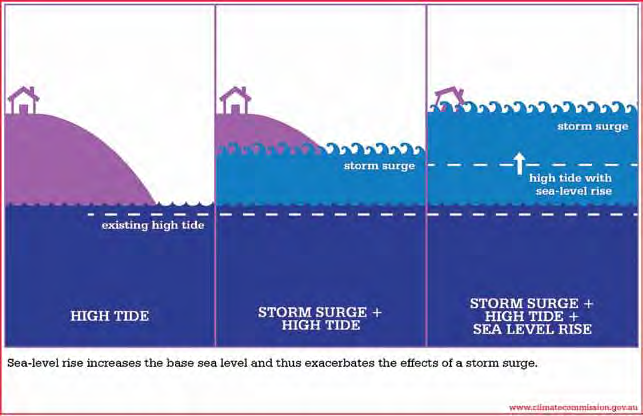
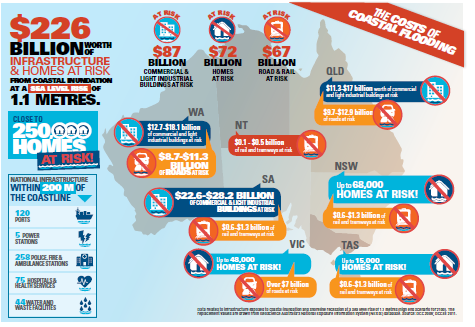
WHAT IT IS: About a quarter of the carbon dioxide emitted into the atmosphere is currently taken up by the oceans, where it reacts with seawater and forms carbonic acid. This “acidification” of global oceans is observed as lower pH levels. Since preindustrial times, the average pH of ocean surface water fell from 8.21 to 8.10. While that does not sound like much, that is a 30 percent increase in acidity, and it could decrease another 0.3 pH units by the end of the century. At that rate, it would create an ocean more acidic than any seen in the past 100 million years.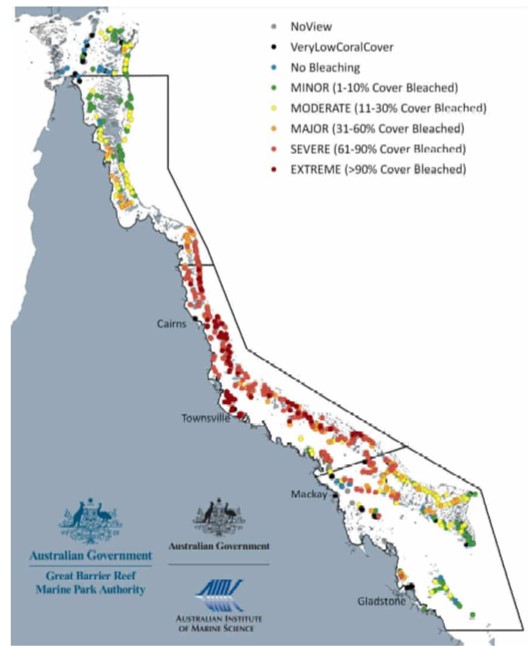 11 May 2022, The Guardian: ‘Devastating’: 91% of reefs surveyed on Great Barrier Reef affected by coral bleaching in 2022. Coral bleaching affected 91% of reefs surveyed along the Great Barrier Reef this year, according to a report by government scientists that confirms the natural landmark has suffered its sixth mass bleaching event on record. The Reef snapshot: summer 2021-22, quietly published by the Great Barrier Reef Marine Park Authority on Tuesday night after weeks of delay, said above-average water temperatures in late summer had caused coral bleaching throughout the 2,300km reef system, but particularly in the central region between Cape Tribulation and the Whitsundays. “The surveys confirm a mass bleaching event, with coral bleaching observed at multiple reefs in all regions,” a statement accompanying the report said. “This is the fourth mass bleaching event since 2016 and the sixth to occur on the Great Barrier Reef since 1998.” It was the first mass bleaching event recorded during a cooler La Niña year. Scientists from the marine park authority and the Australian Institute of Marine Science surveyed 719 shallow water reefs between the Torres Strait and the Capricorn Bunker Group at the southern end of the reef system, mostly using helicopters. They found 654 reefs showed some bleaching. Read more here.
1 June 2015, Wildlife Conservation Society, New climate stress index model challenges doomsday forecasts for world’s coral reefs: Complex model performs better than common temperature threshold predictions. Recent forecasts on the impacts of climate change on the world’s coral reefs–especially ones generated from oceanic surface temperature data gathered by satellites–paint a grim picture for the future of the “rainforests of the sea.” A newer and more complex model incorporating data from both environmental factors and field observations of coral responses to stress provides a better forecasting tool than the more widely used models and a more positive future for coral reefs, according to a new study by the Wildlife Conservation Society and other groups. The study authors point out that, according to the climate stress index model first developed in 2008, coral reefs are responding to more factors than temperature and therefore more resilient to rising temperatures. They conclude that global climate change is the greatest global threat to coral reefs but the future of these ecosystems is more varied than predictions from the more widely used “temperature threshold” models. Read More here
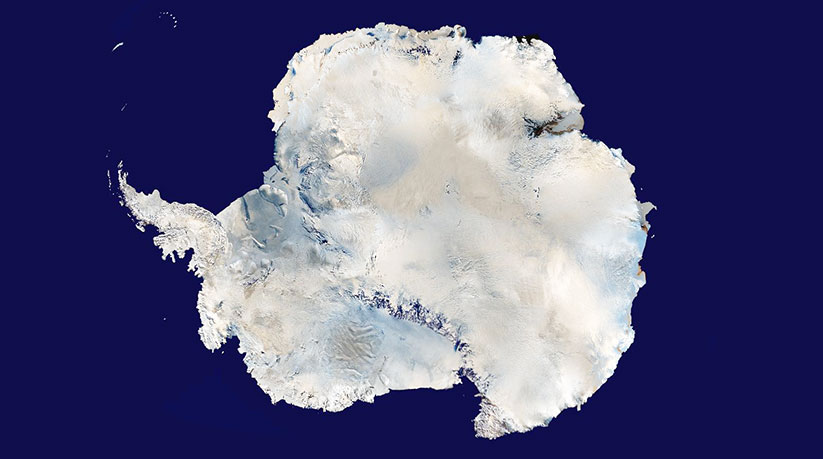 Sentinels of Climate Change: Ice, which covers 10 percent of Earth’s surface, is disappearing rapidly. Select a topic below to see how climate change has affected glaciers, sea ice, and continental ice sheets worldwide. Access NASA’s Global Ice Viewer for time in motion studies of the Earth’s: glaciers; Greenland and Iceland; Arctic and Antarctica. Access view here
21 May 2015, Science Daily, Sudden onset of ice loss in Antarctica so large it affects Earth’s gravity field: Using measurements of the elevation of the Antarctic ice sheet made by a suite of satellites, the researchers found that the Southern Antarctic Peninsula showed no signs of change up to 2009. Around 2009, multiple glaciers along a vast coastal expanse, measuring some 750km in length, suddenly started to shed ice into the ocean at a nearly constant rate of 60 cubic km, or about 55 trillion litres of water, each year. This makes the region the second largest contributor to sea level rise in Antarctica and the ice loss shows no sign of waning. Read More here
11 May 2015, SCIENCEINSIDER: Antarctic researchers ponder challenges posed by increasing sea ice. Scientists working in Antarctica are feeling the impact of climate change in ways the public might find surprising. Although global warming is causing Arctic ice to melt and glaciers around the world to shrink, the problem in Antarctica is that the sea ice surrounding the continent is increasing and now hampering ship navigation and resupply operations. This week, scientists and logistics experts from the 30 nations working on the continent are meeting in Hobart, Australia, to exchange ideas on coping with the sea ice challenge. Read More here
“…The ICECAP (International Collaboration for Exploration of the Cryosphere through Aerogeophysical Profiling) project – a collaboration between US, British and Australian Antarctic researchers – has been mapping the East Antarctic ice sheet to look for changes….And it turns out that East Antarctica needs careful watching. The project is giving us a new look at the underside of the ice sheet in East Antarctica, and causing significant concerns for future increases in sea level. One of the project’s major recent discoveries is that the terrain under the region’s biggest and most important glacier may make it more vulnerable to melting than we thought….” Read More here
FOR MORE IN DEPTH ANALYSIS CONCERNING ANTARCTICA GO TO ANTARCTICA PAGE HERE
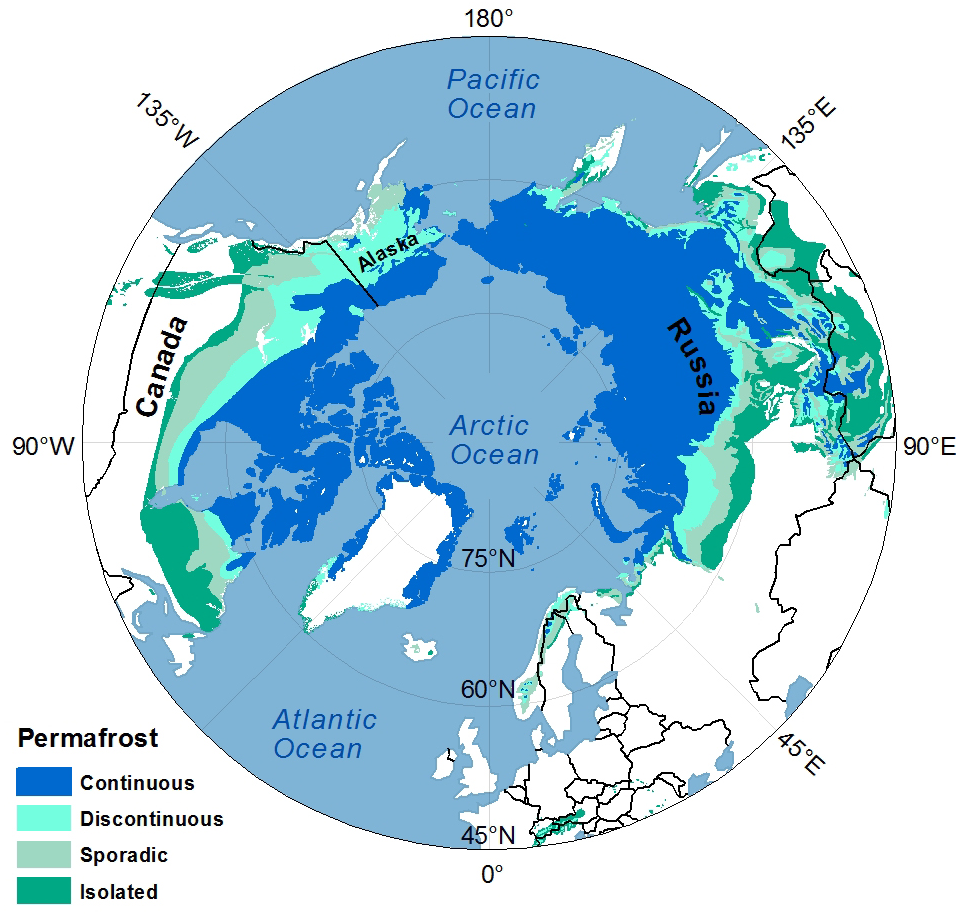 June 2015 Woods Hole Research Center, Policy Brief Permafrost and Global Climate Change KEY SCIENCE POINTS:
- Permafrost contains almost twice as much carbon as the atmosphere.
- As the Earth warms, permafrost thaws, releasing carbon dioxide and methane to the atmosphere.
- The amount and rate of this carbon release will greatly impact Earth’s climate trajectory.
Carbon emissions from thawing arctic permafrost will become substantial within decades, likely exceeding current emissions from fossil fuel combustion in the United States. This will greatly complicate efforts to keep global warming below 2°C and adds urgency to limiting anthropogenic emissions. Unlike fossil fuel emissions, emissions from thawing permafrost build on themselves, because the warming they cause leads to even greater emissions. For this reason, emissions from permafrost could lead to out-of-control global warming. Access full briefing paper here
23 April 2015, Inside Climate News, Thawing Permafrost: A Slow, Giant Carbon Release: As the Arctic heats up at a rate twice that of the rest of the globe and as sea ice and glaciers turn to water, the world’s permafrost is also thawing. A recent review article in the journal Nature found that as the unfrozen organic matter decays, vast stores of carbon in the permafrost could be released into the atmosphere. When that happens, it will trigger a centuries-long, unstoppable feedback system, in which warming will release carbon, which will trigger more warming, which will release more carbon. This infographic shows how and why. Read More here
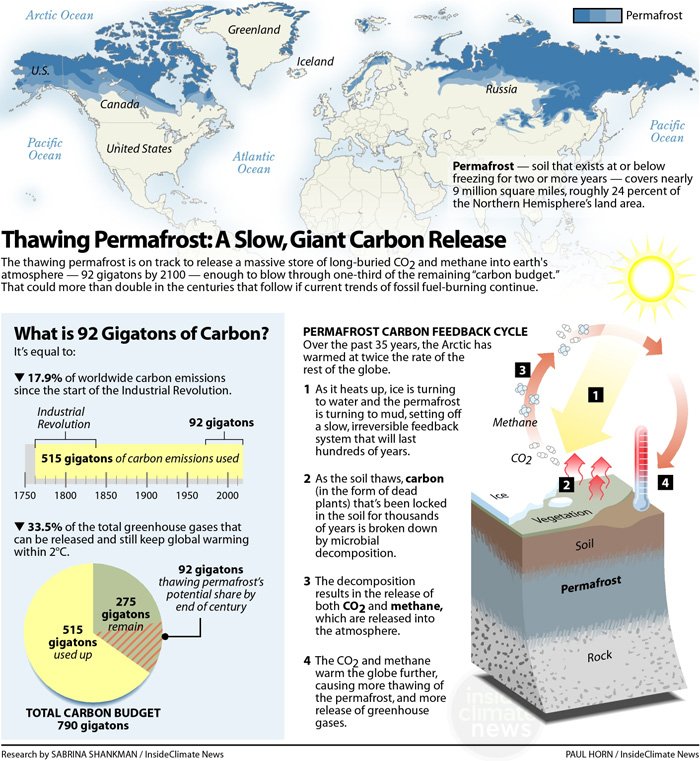
NATURE, the international weekly journal of science, present a selection of overview articles and primary research from Nature, Nature Climate Change, Nature Geoscience, Nature Reviews Microbiology and Nature Communications over the past two years that discuss the interaction between climate change and the permafrost carbon pool, including the role of microbes in permafrost soils. High-latitude permafrost regions store vast amounts of organic carbon. Rising temperatures are causing frozen grounds to thaw, facilitating the microbial decomposition and conversion of soil organic carbon into the greenhouse gases carbon dioxide and methane. The release of permafrost carbon into the atmosphere represents a positive feedback effect that may accelerate climate change. In a related feedback, carbon might be released from submarine permafrost stored beneath the Arctic Ocean’s continental shelves. Read More here
2024 NOAA Arctic Report Card documents rapid, dramatic change
10 December 2024: After storing carbon dioxide in frozen soil for millennia, the Arctic tundra is being transformed by frequent wildfires into an overall source of carbon to the atmosphere, which is already absorbing record levels of heat-trapping fossil fuel pollution. The transition of the Arctic tundra from a carbon sink to a carbon source is one of the dramatic changes in the Arctic that are documented in NOAA’s 2024 Arctic Report Card. Climatic shifts are forcing plants, wildlife and the people that depend on them to rapidly adapt to a warmer, wetter and less certain world. “Our observations now show that the Arctic tundra, which is experiencing warming and increased wildfire, is now emitting more carbon that it stores, which will worsen climate change impacts,” said NOAA Administrator Rick Spinrad, Ph.D. “This is yet one more sign, predicted by scientists, of the consequences of inadequately reducing fossil fuel pollution.” Read More Here
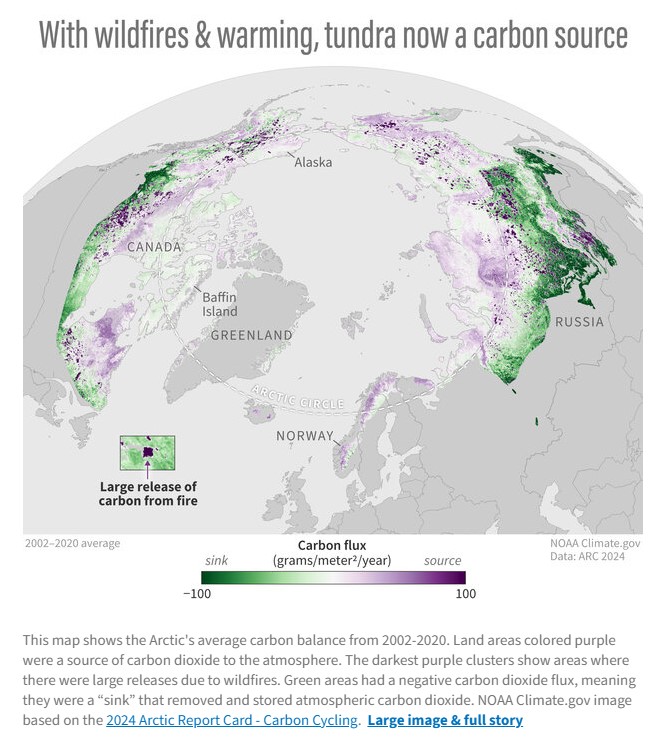
2021 Arctic Report Card
14 December 2021: NOAA’s 2021 Arctic Report Card documents the numerous ways that climate change continues to fundamentally alter this once reliably frozen region, as increasing heat and the loss of snow and ice drive its transformation into a warmer, less frozen, and more uncertain future.
“This year’s Arctic Report Card continues to show how the impacts of human-caused climate change are propelling the Arctic region into a dramatically different state than it was in just a few decades ago,” said NOAA Administrator Rick Spinrad, Ph.D. “The trends are alarming and undeniable. We face a decisive moment. We must take action to confront the climate crisis.” Compiled by 111 scientists from 12 nations, the 2021 Arctic Report Card was released today during a virtual press conference hosted by the American Geophysical Union during its fall meeting in New Orleans. You can read the full press release, scroll down for a collection of images and stories highlighting some of this year’s key findings, or go directly to the Arctic Report Card home page.
SOURCE: NOAA Climate, gov
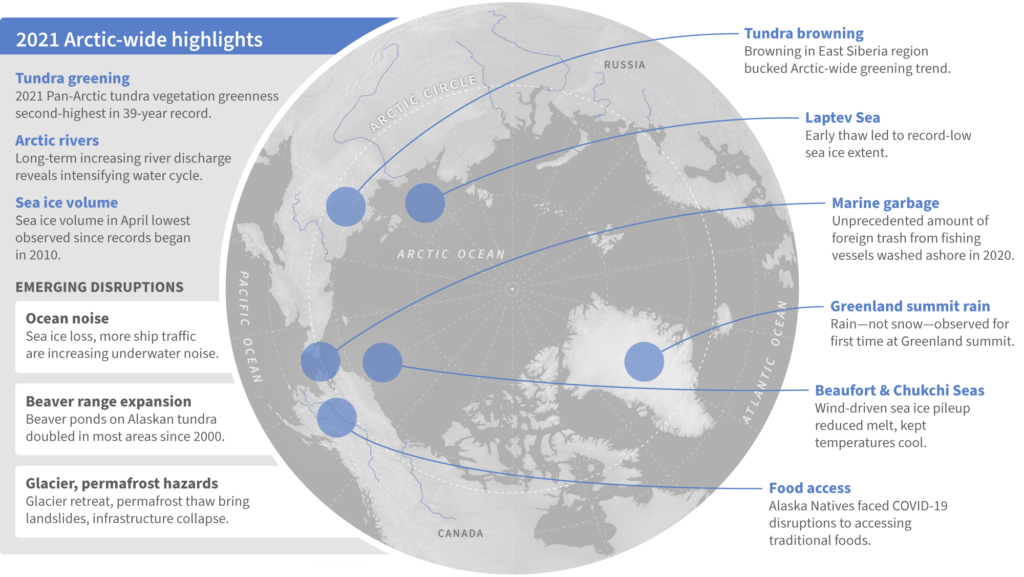
2018 Arctic sea ice minimum continues longer trend
27 September 2018, NOAA, 2018 Arctic sea ice minimum continues longer trend. Arctic sea ice has probably reached its annual minimum for 2018, according to the National Snow and Ice Data Center (NSIDC). Sea ice extent dipped to 1.77 million square miles (4.59 million square kilometers) on September 19, and again on September 23. After that, ice extent began to rise, signaling an end to the summer melt season. The 2018 minimum was nowhere near the record-low extent of 1.31 million square miles (3.39 million square kilometers) recorded on September 17, 2012, but it was nowhere near the 1981–2010 average, either. It was tied with 2008 and 2010 for the sixth-lowest extent in the nearly 40-year satellite record. The 12 lowest Arctic sea ice minimums have all occurred in the last 12 years. Read more here
Arctic causing loopier weather – continuing debate
11 January 2018, Yale Climate Connections, Bomb-cyclone’ weather in a warming world. This month’s Yale Climate Connections ‘This is not Cool’ video offers a plain-English science-based response to the inevitable ‘So much for climate change’ weather riddle. With New England, much of the middle Atlantic region, and parts of the southeast extending well into Florida suffering through late December-, early January-punishing cold temperatures, and in a number of places, record night-time lows and heavy snowfalls – the inevitable “so much for global warming” argument seemed certain to arise. On the one hand there were analytical news stories such as The Washington Post’s Capital Weather Gang’s story headlined “Historic ‘bomb cyclone’ unleashes blizzard conditions from coastal Virginia to New England. Frigid air to follow.” There also was President Trump’s “we could use a little more of that good old global warming” tweet from his “balmy Mar a Lago” residence looking forward to a frigidly cold New Years Eve dropping of the 2018 ball at Times Square in New York City. So how then to explain such not-at-all-unusual experience of cold weather temperatures even as the global temperatures continue rising? (One can safely anticipate having to explain cool summer-time daily temperatures in some places as the world continues warming.) To some extent, it’s a simple question of needing to repeatedly explain the difference between weather (short term and local) and climate (long term and global). Read More here
A QUICK SUMMARY: The Science Linking Arctic Warming to This Crazy-Cold Winter: It’s well known that the rapidly warming Arctic is melting sea ice, thawing permafrost, and accelerating sea-level rise. But a growing body of research suggests, counter intuitively, that it could also be amplifying cold snaps, much like the brutal one now freezing the East Coast.
ANOTHER VIEW: US cold snap was a freak of nature, quick analysis finds. The cold snap that gripped the East Coast and Midwest region was a rarity that bucks the warming trend, said researcher Claudia Tebaldi of the National Center for Atmospheric Research and the private organization Climate Central.
November 2017: Arctic Report Card 2017
Arctic shows no sign of returning to reliably frozen region of recent past decades
The Arctic Report Card 2017 (NOAA) states: Despite relatively cool summer temperatures, observations in 2017 continue to indicate that the Arctic environmental system has reached a ‘new normal’, characterized by long-term losses in the extent and thickness of the sea ice cover, the extent and duration of the winter snow cover and the mass of ice in the Greenland Ice Sheet and Arctic glaciers, and warming sea surface and permafrost temperatures. Read More here
Highlights
- The average surface air temperature for the year ending September 2017 is the 2nd warmest since 1900; however, cooler spring and summer temperatures contributed to a rebound in snow cover in the Eurasian Arctic, slower summer sea ice loss, and below-average melt extent for the Greenland ice sheet.
- The sea ice cover continues to be relatively young and thin with older, thicker ice comprising only 21% of the ice cover in 2017 compared to 45% in 1985.
- In August 2017, sea surface temperatures in the Barents and Chukchi seas were up to 4° C warmer than average, contributing to a delay in the autumn freeze-up in these regions.
- Pronounced increases in ocean primary productivity, at the base of the marine food web, were observed in the Barents and Eurasian Arctic seas from 2003 to 2017.
- Arctic tundra is experiencing increased greenness and record permafrost warming.
- Pervasive changes in the environment are influencing resource management protocols, including those established for fisheries and wildfires.
- The unprecedented rate and global reach of Arctic change disproportionally affect the people of northern communities, further pressing the need to prepare for and adapt to the new Arctic.
About the Arctic Report Card: Issued annually since 2006, the Arctic Report Card is a timely and peer-reviewed source for clear, reliable and concise environmental information on the current state of different components of the Arctic environmental system relative to historical records.The Report Card is intended for a wide audience, including scientists, teachers, students, decision-makers and the general public interested in the Arctic environment and science.
Why does the Arctic matter to us?
19 April 2017, Bloomberg,How a Melting Arctic Changes Everything. Eight countries control land in the Arctic Circle. Five have coastlines to defend. The temperature is rising. The ice is melting. The race for newly accessible resources is beginning. And Russia is gaining ground. The story of the Arctic begins with temperature but it’s so much more—this is a tale about oil and economics, about humanity and science, about politics and borders and the emerging risk of an emboldened and growing Russian empire. The world as a whole has warmed about 0.9 degrees Celsius (1.7 degrees Fahrenheit) since 1880. Arctic temperatures have risen twice that amount during the same time period. The most recent year analyzed, October 2015 to September 2016, was 3.5C warmer than the early 1900s, according to the 2016 Arctic Report Card. Northern Canada, Svalbard, Norway and Russia’s Kara Sea reached an astounding 14C (25F) higher than normal last fall. Scientists refer to these dramatic physical changes as “Arctic amplification,” or positive feedback loops. It’s a little bit like compound interest. A small change snowballs, and Arctic conditions become much less Arctic, much more quickly. “After studying the Arctic and its climate for three-and-a-half decades,” Mark Serreze, director of the National Snow and Ice Data center, wrote recently. “I have concluded that what has happened over the last year goes beyond even the extreme.” ….The warming Arctic offers an economic opportunity for nations to access resources. But first, nations must sort out questions of boundaries and access—and Russia did not expand to 11 time zones by missing opportunities such as this. More than 4 million people live north of Earth’s Arctic Circle, nearly half of them in Russia and the rest scattered among the seven other northernmost countries—the U.S., Canada, Greenland, Iceland, Norway, Sweden, and Finland. About 500,000 people live among one of dozens of indigenous nations whose ancestry and bonds extend beyond modern borders. Over the most recent generation, many of these communities have banded together into large regional organizations that promote their interests among the international community. Access extensive report here
17 October 2016, Yale Climate Connections: A new six-minute video on the changing nature of Arctic sea ice and its implications for weather far and wide answers the ‘Why does it matter to us?’ question.
The video by Peter Sinclair explores the perspectives of leading sea ice experts. In a span of six minutes, those experts paint an all-you-may-ever-need-to-know portrait of the Arctic’s changing sea ice. And they explain how those changes are altering weather patterns in the U.S. and elsewhere. Access article here
The Winter of Blazing Discontent Continues in the Arctic
 6 February 2017, Climate Central, These are some of the words that describe what’s been happening in the Arctic over the past year as surge after surge of warm air have stalled, and at times reversed, sea ice pack growth. And the unfortunate string of superlatives is set to continue this week. Arctic sea ice is already sitting at a record low for this time of year and a powerful North Atlantic storm is expected to open the flood gates and send more warmth pouring into the region from the lower latitudes. By Thursday, it could reach up to 50°F above normal. In absolute temperature, that’s near the freezing point and could further spur a decline in sea ice. Scientists have said the past year in the Arctic is “beyond even the extreme” as climate change remakes the region. Sea ice hit a record low maximum last winter (for the second year in a row, no less) and the second-lowest minimum ever recorded last fall. After a fairly rapid refreeze in late September, the region experienced a dramatic shift. Extraordinary warmth has been a recurring theme. Read More here
 22 March 2017, Climate Central, Arctic Sea Ice Sets Record-Low Peak for Third Year. Constant warmth punctuated by repeated winter heat waves stymied Arctic sea ice growth this winter, leaving the winter sea ice cover missing an area the size of California and Texas combined and setting a record-low maximum for the third year in a row. Even in the context of the decades of greenhouse gas-driven warming, and subsequent ice loss in the Arctic, this winter’s weather stood out. “I have been looking at Arctic weather patterns for 35 years and have never seen anything close to what we’ve experienced these past two winters,” Mark Serreze, director of the National Snow and Ice Data Center, which keeps track of sea ice levels, said in a statement.
 The sea ice fringing Antarctica also set a record low for its annual summer minimum (with the seasons opposite in the Southern Hemisphere), though this was in sharp contrast to the record highs racked up in recent years. Researchers are still investigating what forces, including global warming, are driving Antarctic sea ice trends. Sea ice is a crucial part of the ecosystems at both poles, providing habitat and influencing food availability for penguins, polar bears and other native species. Arctic sea ice melt fueled by ever-rising global temperatures is also opening the already fragile region to increased shipping traffic and may be affecting weather patterns over Europe, Asia and North America. Read More here
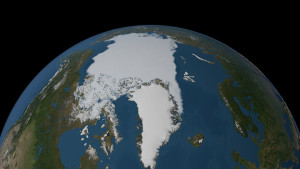
Click on the map to open NASA’s visualization which shows the annual Arctic sea ice minimum from 1979 to 2014. At the end of each summer, the sea ice cover reaches its minimum extent, leaving what is called the perennial ice cover. The area of the perennial ice has been steadily decreasing since the satellite record began in 1979. Data source: Satellite observations. Credit: NASA Scientific Visualization Studio
15 September 2016, NASA: The following animation shows the evolution of the Arctic sea ice cover from its wintertime maximum extent, which was reached on Mar. 24, 2016, and was the lowest on record for the second year in a row, to its apparent yearly minimum, which occurred on Sept. 10, 2016, and is the second lowest in the satellite era. Credit: NASA Goddard’s Scientific Visualization Studio/C. Starr. This video is public domain and can be downloaded from the Scientific Visualization Studio.
Arctic sea ice appeared to have reached its annual lowest extent on Sept. 10, NASA and the NASA-supported National Snow and Ice Data Center (NSIDC) at the University of Colorado at Boulder reported today. Read More here
27 August 2015, Climate News Network, New NASA videos show stark ice loss from Earth’s ice sheets. The US space agency, NASA, yesterday released brand new images showing the pace of ice loss from Earth’s two vast ice sheets, Greenland and Antarctica.The amount of ice lost from the frozen expanses at the very north and south of the planet is accelerating, say the scientists, and together have helped raise global sea level by more than 7cm since 1992.
Change in the mass of the Greenland Ice Sheet between January 2004 and June 2014, as measured by the GRACE satellite. Source: NASA Goddard’s Scientific Visualization Studio. The stunning video images above come from the Gravity Recovery and Climate Experiment (GRACE ) twin-satellite. The satellites orbit the poles, measuring changes to the Earth’s land and water masses and work out differences in the planet’s gravitational field every 30 days. Some of the ice lost from Greenland is as result of the huge glaciers melting. But most of it is down to warming air overhead directly melting the surface of the ice sheet. A NASA press release accompanying yesterday’s data explains: Read More here
Arctic sea ice has been retreating rapidly in recent years as a result of greenhouse gases building up in the atmosphere, explained Dr Dirk Notz, sea ice expert at the Max Planck Institute in Germany. The biggest losses are happening in summer, he said: “Over the past 10 years or so, we’ve roughly seen a 50% loss of Arctic sea ice area. So, the ice in the Arctic is currently retreating very, very rapidly.” In March, Arctic sea ice reached its lowest maximum extent in the satellite record. Last week, the US National Snow and Ice Data Centre confirmed Arctic sea ice extent for May was the third lowest on record. Read More here
Rapid Arctic warming is changing the Jet stream and our weather along with it
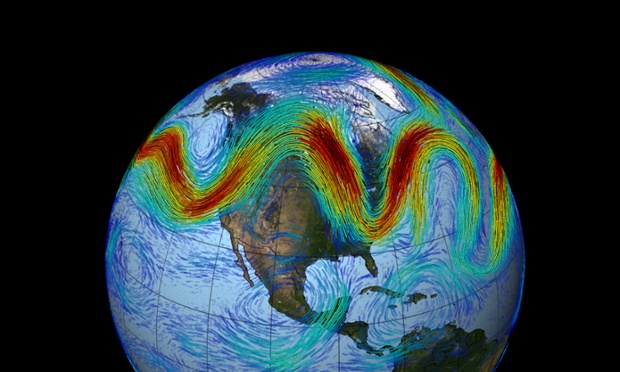
We know that the Arctic is heating faster than the planet as a whole. Consequently, there is more energy in the Arctic which can be transmitted to the atmosphere. Much of the excess heat is transferred to the atmosphere in the late fall or early winter. This extra energy is connected to what’s called Arctic geopotential height, which has increased during the same times of the year. As a consequence, the Jetstream might weaken in the cold seasons.
But what about summer? Have these changes been detected then too? Well just recently, a paper was published in that answered this question. The authors, from the Potsdam Institute for Climate Impact Research and from the University of Potsdam reported on three measures of atmospheric dynamics (1) zonal winds, (2) eddy kinetic energy, and (3) amplitude of the fast-moving Rossby waves. Rossby waves are very large waves in the upper atmospheric winds. They are important because of their large influence on weather. The authors found that the summer zonal winds have weakened. The reason for the weakening is that since the Arctic is warming faster than the rest of the planet, the temperature difference between the Arctic and the lower latitudes is getting smaller. It is this temperature difference which maintains the wind speeds. The authors also found that eddy kinetic energy is decreasing.
So what does all this mean? Well two things. First, it means that there are either fewer or less intense summer storms or a combination of both. But secondly, it means that weather patterns can get “stuck”. Storms are excellent at breaking up persistent weather patterns, and bringing cool and moist air from ocean regions to land zones. With fewer storms, “warm weather conditions endure, resulting in buildup of heat and drought.” Read More here
EIGHTH STORY – Arctic: A last great unprotected wilderness, safe haven for endangered species and home to native people whose subsistence lifestyle has survived in harmony with nature for thousands of years. 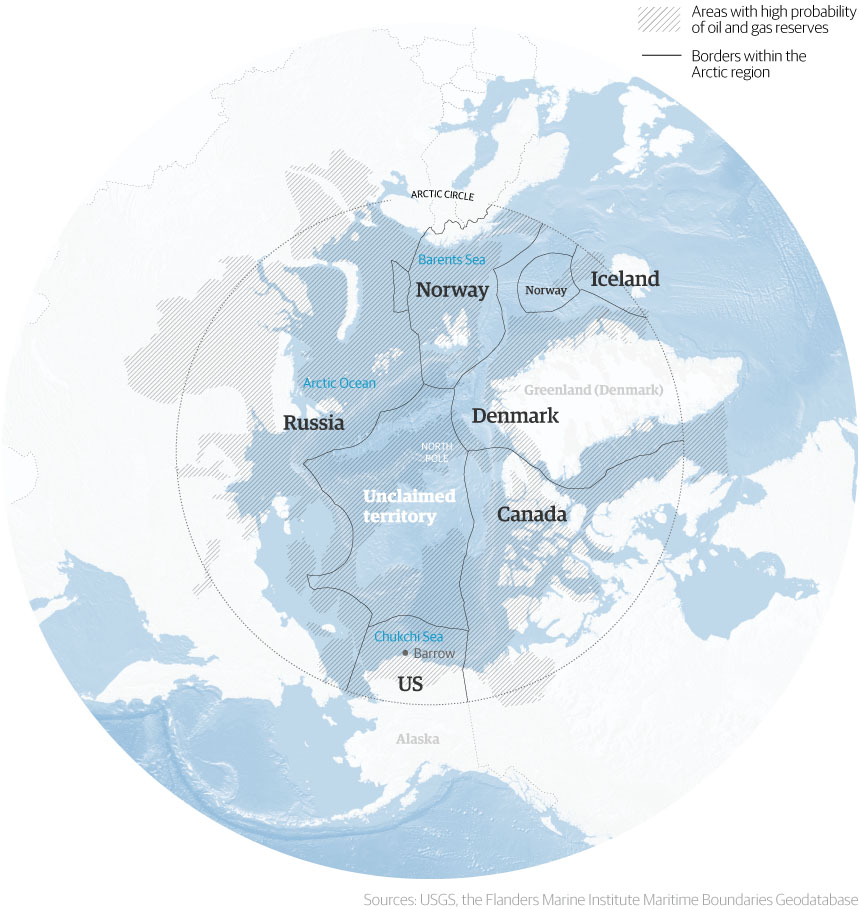 It is here that Shell plans to drill for oil, pulling the detonator on a carbon bomb which eventually could spray 150bn tonnes of carbon dioxide into the atmosphere.
The irony is that the drilling is only possible because manmade climate change is already causing this region to grow warmer twice as fast as the rest of the planet. The melting ice makes these huge reserves of oil and gas more accessible. It could set major oil companies against each other but also superpower against superpower as they scramble to exploit the last untapped giant reserves in a part of the world where territorial boundaries remain unclear. No wonder some fear a new cold war. Read More here
Cumulative human impacts on world oceans
14 July 2015, Nature Communications, NEW RESEARCH: Spatial and temporal changes in cumulative human impacts on the world’s ocean: Human pressures on the ocean are thought to be increasing globally, yet we know little about their patterns of cumulative change, which pressures are most responsible for change, and which places are experiencing the greatest increases. Managers and policymakers require such information to make strategic decisions and monitor progress towards management objectives. Here we calculate and map recent change over 5 years in cumulative impacts to marine ecosystems globally from fishing, climate change, and ocean- and land-based stressors. Nearly 66% of the ocean and 77% of national jurisdictions show increased human impact, driven mostly by climate change pressures. Five percent of the ocean is heavily impacted with increasing pressures, requiring management attention. Ten percent has very low impact with decreasing pressures. Our results provide large-scale guidance about where to prioritize management efforts and affirm the importance of addressing climate change to maintain and improve the condition of marine ecosystems. Access full report here – access full size maps from report here
Key Information & Resource Sites
- Bureau of Meteorology – BOM reports and news; El Nino / La Nina; Climate change & variability; Weather extremes; Australian climate influences
- CSIRO – Environment;
- Climate Council – Reports and news; renewables
- Climate Institute – Reports; News
- Scientific Committee on Antarctic Research (SCAR)
- Arctic Regional Ocean Observing System
- Scorcher website has three main functions:to display where in Australia heatwaves are currently occurring; highlight recent and past heatwaves events for individual observation sites; and summarise information of past events at each site.
- Australian Academy of Science
- Climate Change in Australia: A. Climate Change in Australia (or CCIA) is a comprehensive website and suite of reports providing information about climate change projections for Australia. This body of work updates the previous CCIA research published in 2007.
- NASA The GO TO place for global stats and analysis
- NOAA From supercomputers and state-of-the-art models to observations and outlooks, we provide data, tools, and information to help people understand and prepare for climate variability and change.
- CO2 – Earth CO2.Earth is here to track the atmospheric CO2 trend along with you. Any time you want an update for earth’s planetary vital signs, CO2.Earth points to the latest numbers.