
What you will find on this page: Understanding what drives climate in Victoria (video); State of the Climate 2018 report; State of the Climate Report 2016 (video); climate zones on the move; Australia’s changing rainfall zones; BOM UPDATES: ENSO Wrap-up (El Nino/La Nina); climate outlook update (video); climate outlook – monthly & seasonal; latest drought statement; heatwave outlook; Water in Australia 2014-2015 Report; monthly water update; Australian landscape water balance;
Where the rubber hits the road – what IS the weather doing?
The difference between weather and climate is a measure of time. Weather is what conditions of the atmosphere are over a short period of time, and climate is how the atmosphere “behaves” over relatively long periods of time. (NASA)
Understanding what drives climate in Victoria and how they are changing
The Climatedogs animation series is an award winning series of short animated videos produced by DEPI. The animations explain what drives the climate in Victoria, and how climate drivers are changing over time. Access here for more information
State of the Climate 2018
- Oceans around Australia have warmed by around 1 °C since 1910, contributing to longer and more frequent marine heatwaves.
- Sea levels are rising around Australia, increasing the risk of inundation.
- The oceans around Australia are acidifying (the pH is decreasing).
- April to October rainfall has decreased in the southwest of Australia. Across the same region May–July rainfall has seen the largest decrease, by around 20 per cent since 1970.
- There has been a decline of around 11 per cent in April–October rainfall in the southeast of Australia since the late 1990s.
- Rainfall has increased across parts of northern Australia since the 1970s.
- Streamflow has decreased across southern Australia. Streamflow has increased in northern Australia where rainfall has increased.
- There has been a long‑term increase in extreme fire weather, and in the length of the fire season, across large parts of Australia
Rule of Thumb; For every one degree increase in global average temperature the climate zones can move 150kms.
 As the planet warms, Earth’s climate zones are shifting at an accelerating pace….The acceleration of change means that the species inhabiting each zone have less time to adapt to the climatic changes…. “The warmer the climate gets, the faster the climate zones are shifting. This could make it harder for plants and animals to adjust.” Read More here & here
According to research in Nature Climate Change, with a warming of 2°C, about 5% of land would shift into a new climate zone. As the temperatures rise another 2°C, 10% of the land area shifts to a new zone.
The results of a study published in the journal Biological Conservation recently concluded that in Australia, the climate is warming to an extent that many specialised tree species that require cooler climates are struggling. Typically, these trees would start to shift to cooler environments, but as Craig Costion explained “they already live on mountain tops…they have no other place to go.”
Australia’s changing rainfall zones
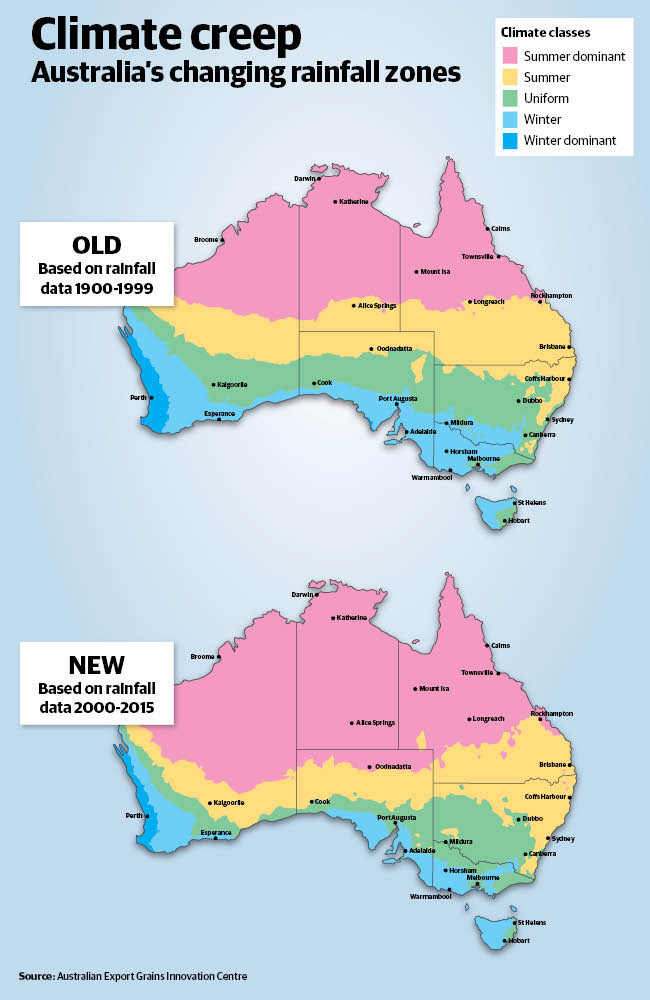
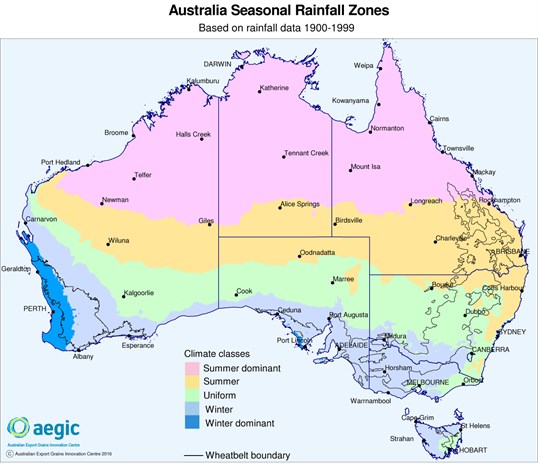
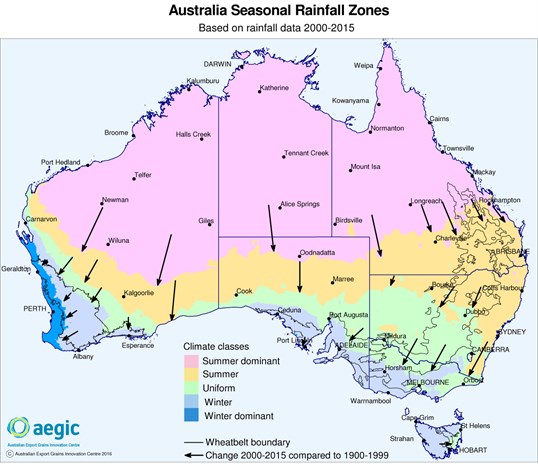
Source: Australian Export Grains Innovation Centre
BOM Newsroom for latest weather alerts
The Bureau of Meteorology Newsroom has been designed to provide material that can be easily sourced and referenced by journalists in media coverage of weather, warnings and other information of public interest. Access Newsroom here
Issued on ext issue
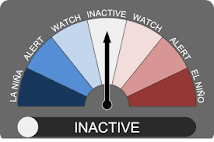
The El Niño–Southern Oscillation (ENSO) and Indian Ocean Dipole (IOD) both remain neutral. Neutral ENSO conditions are likely to persist over the coming months, with some likelihood a La Niña-like state could develop in the tropical Pacific Ocean late in the southern hemisphere winter or spring (less than 50% chance). Most models suggest a negative IOD could develop in the Indian Ocean from mid-winter.
Atmospheric and oceanic indicators of ENSO including the Southern Oscillation Index (SOI), trade winds, cloudiness near the Date Line, and sea surface temperatures in the tropical Pacific Ocean generally persist at levels consistent with a neutral ENSO state. Sub-surface temperatures in the tropical Pacific Ocean have cooled over the past two months, indicating increased potential for cooling at the surface in the coming months under the right conditions.
Most climate models surveyed by the Bureau indicate that ENSO is likely to stay neutral through the southern hemisphere winter. By late winter/early spring, three of the eight climate models surveyed by the Bureau reach or exceed La Niña levels, while the remaining five stay neutral. ENSO predictions made during autumn tend to have lower accuracy than predictions made at other times of the year, so current ENSO forecasts should be used with some caution. The Bureau’s ENSO Outlook remains at INACTIVE but conditions and outlooks will be assessed regularly against the criteria needed for elevation to La Niña WATCH.
The Indian Ocean Dipole (IOD) is currently neutral. All six international climate models surveyed suggest negative IOD conditions could develop from the middle of the southern hemisphere winter. However, each of the models show a broad spread of possible scenarios between the neutral IOD and negative IOD levels, with almost no sign of a re-emergence of a positive IOD event. But again, caution must be taken as accuracy of IOD forecasts made at this time of year is low, with forecast accuracy improving from late autumn. A negative IOD typically brings above average winter–spring rainfall to southern Australia.
The Southern Annular Mode (SAM) is currently negative but is forecast to return to neutral levels in the next few days and remain neutral for the coming three weeks. SAM has little influence upon Australian rainfall in autumn.
Issued 30 January 2020
BOM Climate outlooks – monthly and seasonal
Climate outlook overview (access full outlook here)
Issued:
-
-
- Early May is looking drier than average, with the week of 4 to 10 May likely to bring reduced rainfall for most of Australia.
- May to July overall is likely to be wetter than average for most of the southern two-thirds of Australia. However, parts of the tropical north, and areas east of the Great Dividing Range have roughly equal chances of being wetter or drier than average.
- May to July days are likely to be warmer than average across northern, eastern and far southwest Australia while nights are very likely to be warmer than average nationwide.
- A warmer than average eastern Indian Ocean is currently the main influence on Australia’s climate, increasing the moisture available to weather systems as they sweep across the country.
- Early May is looking drier than average, with the week of 4 to 10 May likely to bring reduced rainfall for most of Australia.
-
BOM Heatwave Service for Australia
The Heatwave Forecast is a Bureau of Meteorology product that shows the location of heatwaves, severe heatwaves and extreme heatwaves for the last two three-day periods and the next five three-day periods. It uses some analysis Numerical Weather Prediction model data, not the Official Forecast data. Please refer to official Bureau of Meteorology products for information on how hot each day and night will be during the three day period. Click on image to access BOM site.
Water in Australia – 2014-2015 BOM Report
Water in Australia 2014–15 describes the characteristics of the country’s water resources, availability and use from 1 July 2014 to 30 June 2015 in the context of climatic conditions, and past water availability and use. In 2014–15, Australia generally experienced below-average rainfall (10 per cent less than the national average since 1910–11) with large seasonal and regional variation, including below-average rainfall throughout the east, and above-average rainfall in the central north, northwest and southeast. Mainly in the eastern parts of Australia, these patterns were influenced by near-El Niño conditions in spring 2014, evolving into El Niño by May 2015. Read More here
BOM Monthly Water Update
The BOM Monthly Water Update provides an overview of rainfall patterns and streamflow status across Australia. Rainfall is a key driver of streamflow and is shown alongside flows from over 222 gauging stations, across 9 of the 13 topographic drainage divisions in Australia. The Monthly Water Update interprets the hydrological status of surface water flows each month using provisional information from data providers.
BOM Australian Landscape Water Balance
 Details accessed through date and location – go here The landscape water balance is the sum of the hydrological processes that keep water moving through a landscape—recharging groundwater, filling streams and flushing water through wetlands. This water balance also determines how much moisture is in the soil—a vital input for seasonal planting and crop production decisions.