What you will find on this page: LATEST NEWS; Fossil fuel emissions have stalled; Analysis: Record surge of clean energy in 2024 halts China’s CO2 rise; does the world need hydrogen?; Mapped: global coal trade; Complexity of energy systems (maps); Mapped: Germany’s energy sources (interactive access); Power to the people (video); Unburnable Carbon (report); Stern Commission Review; Garnaut reports; live generation data; fossil fuel subsidies; divestment; how to run a divestment campaign guide; local council divestment guide; US coal plant retirement; oil conventional & unconventional; CSG battle in Australia (videos); CSG battle in Victoria; leasing maps for Victoria; coal projects Victoria
Huge task to decarbonise
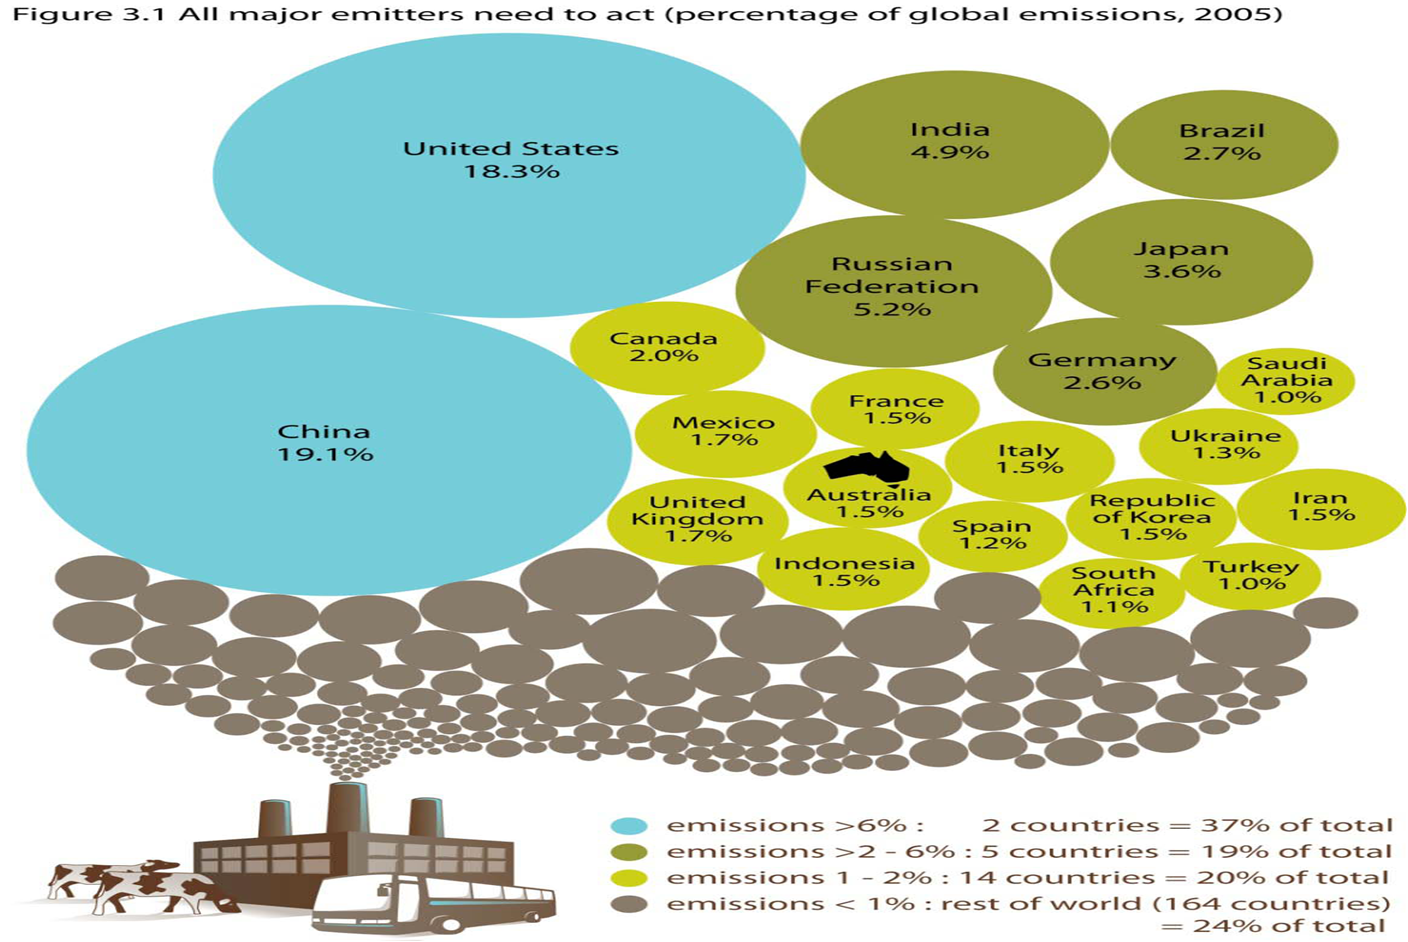
Source: Australian Delegation presentation to international forum held in Bonn in May 2012
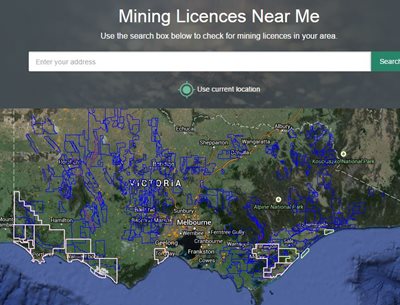
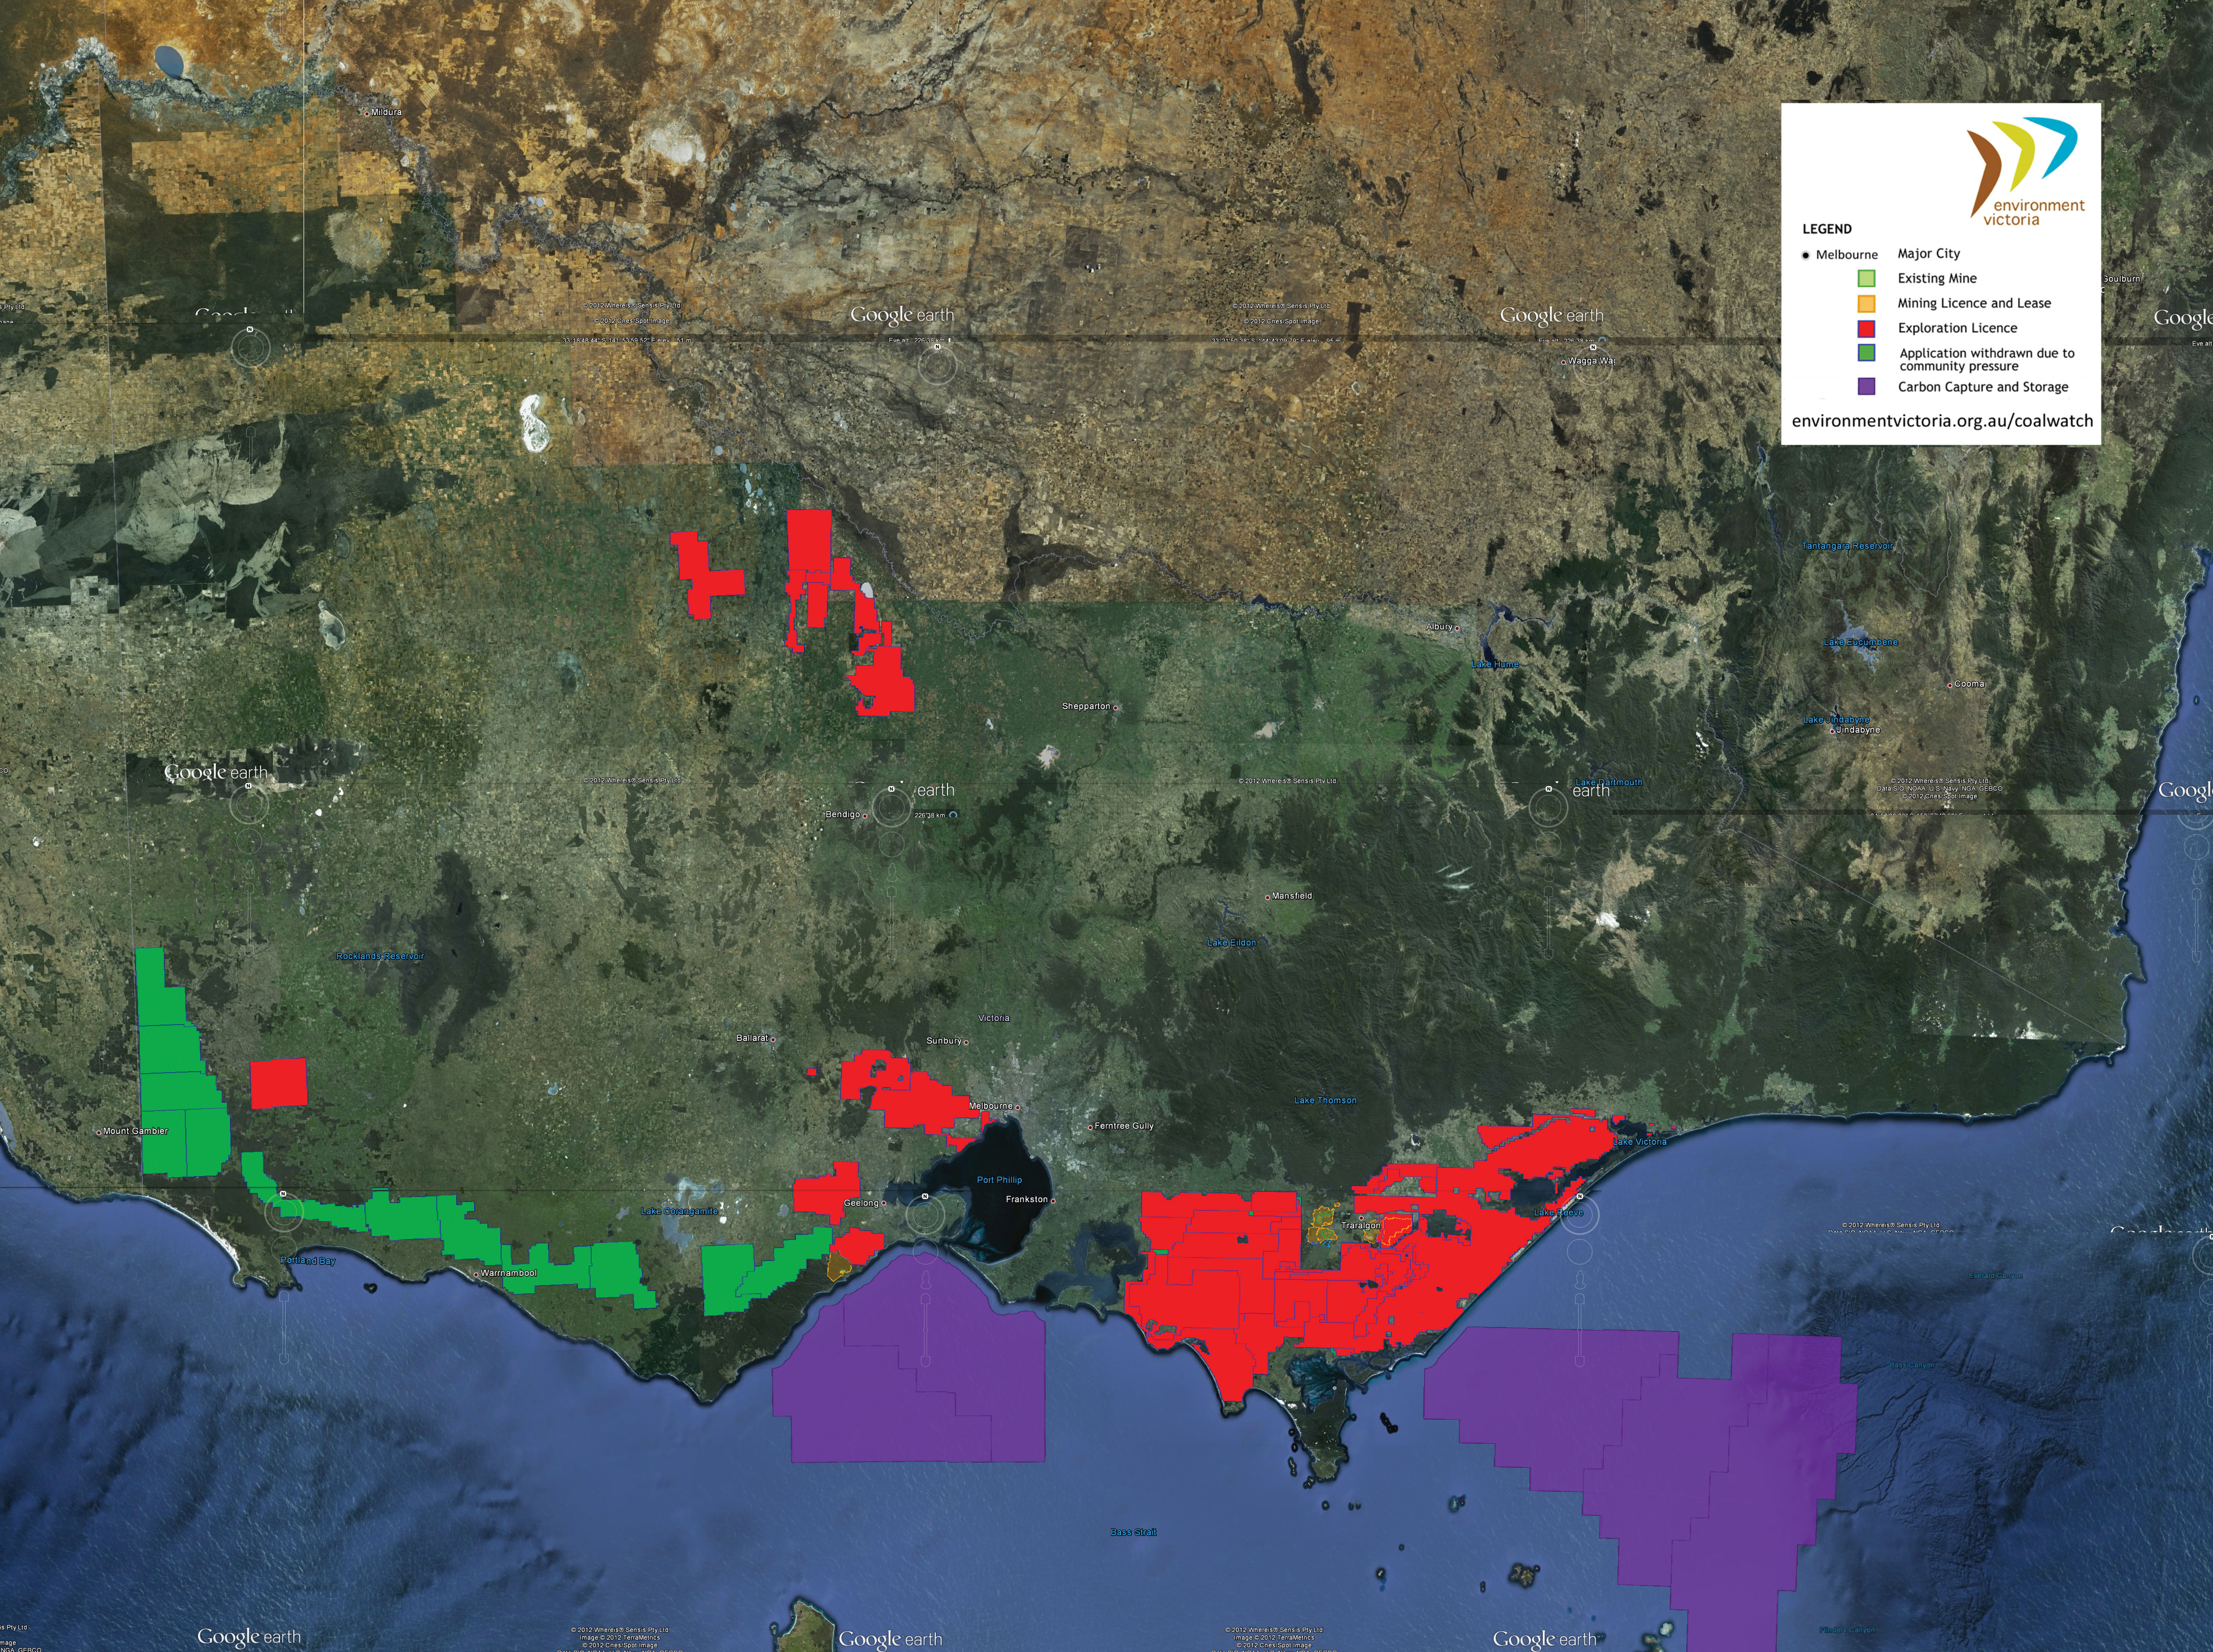
Latest News 23 March 2017, Renew Economy, Fairfax joins media hysteria over post-Hazelwood “blackouts”. The warnings of blackouts provoked by the imminent closure of the Hazelwood brown coal generator in Victoria– already so prevalent on right wing blogs, the Murdoch media and the ABC – reached fever pitched proportions on Thursday. Fairfax Media led the front page of The Age newspaper (see image right) with an “exclusive” story that warned of 72 days of potential blackouts across the state over the next two summers. “Victoria’s energy security has been thrown into question, with the state facing an unprecedented 72 days of possible power supply shortfalls over the next two years following the shutdown of the Hazelwood plant next week,” the story by Josh Gordon begins. And how does it come to this breathless conclusion? Fairfax, like other media, such as the ABC’s political editor, Chris Uhlmann, is basing the forecasts of blackouts on this graph that appears on the website of the Australian Energy Market Operator. It purports to show – in the light red at the top – the periods when Victoria could face a shortfall of supply. The graph for South Australia is even more dramatic. But is that really what is says? Blackouts all summer? Not at all, says the AEMO – a reply they would happily give anyone who bothered to ask. It actually shows the most extreme demand scenarios that it can think of – a one in ten year likelihood in this case – and graphs that over and above what it considers to be the “average” supply. Repeat. That is average supply, not total supply available. Assuming this would lead to blackouts is a bit like saying that someone who walks to the ocean edge at low tide risks getting wet when the tide comes in, and they don’t move. There is plenty of excess capacity that can meet that demand. This graph, is a section known as its Mtpasa forecasts, is basically a heads up that the tide will come in, and generator owners might want to think about maintenance planning, switching them on etc etc, to take it into account. Read More here 18 March 2017, The Guardian, CO2 emissions stay same for third year in row – despite global economy growing. International Energy Agency report puts halt in emissions from energy down to growth in renewable power. Carbon dioxide emissions from energy have not increased for three years in a row even as the global economy grew, the International Energy Agency (IEA) said. Global emissions from the energy sector were 32.1bn tonnes in 2016, the same as the previous two years, while the economy grew 3.1%, the organisation said. The IEA put the halt in growth down to growing renewable power generation, switches from coal to natural gas and improvements in energy efficiency but said it is too soon to say that global emissions have peaked. The biggest drop was seen in the US, where carbon dioxide emissions fell 3%, while the economy grew 1.6%, following a surge in shale gas supplies and more renewable power that displaced coal. US emissions are at their lowest level since 1992, while the economy has grown 80% since that time….. The pause in emissions growth was welcomed by the IEA, but it warned it was not enough to meet globally-agreed targets to limit temperature rises to below 2C above pre-industrial levels – considered to be the threshold for dangerous climate change. Read More here 15 March 2017, The Guardian, Renewables roadshow: how Daylesford’s windfarm took back the power. From the fertile spud-growing country of Hepburn Shire, 90km northwest of Melbourne, has sprung what many hope will become a revolution in renewable energy in Australia. On Leonards Hill, just outside the town of Daylesford – famed for its natural springs – stand two wind turbines that not only power the local area, but have also added substantial power to the community-owned renewable energy movement in Australia. The turbines, cheesily called Gusto and Gale, constitute the very first community-owned windfarm in Australia. It borrows the idea from a long tradition of community-owned power that was forgotten in Australia, but lives on strongly in Denmark. “In Denmark there’s over 2,100 versions of this,” says Taryn Lane, the community manager for Hepburn Wind, the cooperative that owns and operates the windfarm. “Their model – this way of owning your own energy generator locally – emerged in the late 70s, so they have been doing it for decades.” It was at a community meeting for a large corporate-owned windfarm, like the one near Hepburn, that the idea for Hepburn Wind emerged. Strong community opposition, often encouraged by the fossil fuel industry, has at times been a roadblock for large windfarms built by traditional energy companies. Lane says the Danish founder of Hepburn Wind, Per Bernard, attended the meeting with a few people from Daylesford, and they saw the community express a lot of opposition to one of those projects. “They were quite disappointed that that was our local area’s first response to large-scale renewables development in the area,” Lane says. Bernard figured that if they adopted the Danish model, where the windfarm was smaller, and the local community owned it, support for clean, clean wind energy would grow. The idea of communities owning their own power generators is not new in Australia, according to Lane, it’s just been forgotten. That was the way electricity was first introduced into much of the country, with smaller decentralised generators, owned by the local communities. The mayor of Hepburn Shire, Sebastian Klein agrees. “Hepburn actually used to own its own power generating sources. We used to have our own generator in the main street of Daylesford [and] we used to have our own hydro station down at the lake,” he says. Read More here 15 March 2017, The Climate Institute, The Climate Institute welcomes the opportunity to provide input to the Independent Review into the Future Security of the National Electricity Market. This submission comprises two parts: first, a detailed discussion of the five priorities we believe the review needs to address, which are summarised below, and second, responses to a selection of questions from the Independent Review’s Preliminary Report. For further information regarding any of the issues covered in this submission, please contact Olivia Kember, Head of Policy at The Climate Institute, at 02 8239 6299 or okember@climateinstitute.org.au. Five priorities for the future security of the national electricity system: Access full submission here 14 November 219, Renew Economy, Australia set to lie with some strange bedfellows at Madrid climate talks. Australia is likely to find itself relying on some unlikely alliances at the next round of international climate talks to be held in Madrid next month, as the Morrison government faces opposition from a large portion of the international community on the carryover of surplus Kyoto units. As part of the plan to meet Australia’s 26 to 28 per cent emissions reduction goal by 2030, the Morrison government is relying on being able to carry over credit from its 2020 Kyoto Protocol target into the Paris Agreement, to shortcut the amount of greenhouse emissions reductions it will need to achieve. International cooperation on climate change is at a crucial transition point with the previous Kyoto Protocol treaty, which has been in effect since 2008, coming to an end in 2020 when the Paris Agreement comes into force, effectively replacing the Kyoto Protocol. A key area of contention for the COP25 talks in Madrid will be negotiations around the rules for emissions accounting and international cooperation. Read more here 5 November 2019, The Conversation. Scott Morrison wants to outlaw boycott campaigns. But the mining industry doesn’t need protection. On Friday, Prime Minister Scott Morrison vowed to craft new laws targeting social and political protest. Speaking to the Queensland Resources Council, he labelled some activist groups as environmental “anarchists”, and lamented how businesses like banks might be sensitive to consumer or protest group pressure to limit dealings with the mining industry. These laws could ban activists from advocating for certain boycotts against companies. Morrison lambasted progressives, saying they: want to tell you where to live, what job you can have, what you can say and what you can think – and tax you more for the privilege of all of those instructions. Boycott laws already exist. The first thing to note is there is no proposal on the table. Morrison merely warned his government was: working to identify mechanisms that can successfully outlaw these indulgent and selfish practices. The existing law on boycotts has been driven by conservative governments. In the 1970s, the Fraser government sought to crack down on “secondary boycotts”, with stiff provisions in trade practices or competition law. Morrison also specifically invoked “secondary boycotts” in his speech. Read more here 1 November 2019, Renew Economy. Taylor’s ‘expert panel’ in search of emissions reductions shuts out clean energy sector. The ‘expert panel’ to which the Morrison government has delegated responsibility for searching out new sources emissions reductions this week, has effectively shut out the clean energy sector from its secret consultation process. This week, details emerged that federal minister for energy and emissions reduction, Angus Taylor, had stacked the ‘expert panel’, government reps and led by a pair with close ties to the fossil fuel sector. The ‘Expert Panel Examining Opportunities for Further Abatement’ has released a discussion paper, which flags the desire of the Morrison Government to use its rebranded Climate Solutions Fund to eke out additional emissions reduction, in an acknowledgement that the government is not on track to meet its 2030 emissions reduction target. Read more here 30 October 2019, Renew Economy. Coalition gives $1bn to CEFC for 24/7 reliable renewable power. The federal Coalition government has injected another $1 billion into the $10 billion Clean Energy Finance Corporation – the same Labor-established green bank his party tried for years to abolish and hamstring – to underwrite renewables integration and grid stabilisation technologies. The Liberal National government said on Wednesday that it would establish a $1 billion Grid Reliability Fund to support investment in new energy generation, storage and transmission infrastructure, including projects shortlisted for its Underwriting New Generation Investments (UNGI) program. The joint statement from Prime Minister Scott Morrison, energy minister Angus Taylor and minister for finance Mathias Cormann said eligible investments for the new fund would include energy storage projects like pumped hydro and batteries, transmission and distribution infrastructure, and grid stabilising technologies. Read more here 5 March 2025, Climate Home News: Countries fail again to decide timing of key IPCC climate science reports. China, Saudi Arabia and India pushed back against a proposal to align the IPCC flagship reports with the timeline of the global stocktake of climate action. Governments have delayed for the third time a key decision on the timing of an influential climate science assessment, after failing to resolve deep divisions at a meeting of the Intergovernmental Panel on Climate Change (IPCC) over whether and how to align its work with UN climate policy. While officials agreed on the outline of the IPCC’s three flagship reports in Hangzhou, China, on Saturday, they failed to break the deadlock on when they should be delivered, despite week-long talks running into overtime with a nearly uninterrupted 30-hour session on the closing day. Most governments spoke in favour of a proposal put forward by the IPCC’s administrative arm to conclude the scientific review process by August 2028, so that the reports would be ready in time to be considered as part of the “Global Stocktake”, a scorecard of climate action carried out under the Paris Agreement. European nations, Japan, Turkiye, small island states and most Latin American and least developed countries supported the plan, three delegates told Climate Home. But China, Saudi Arabia and India strongly pushed back against that timeline, while South Africa and Kenya asked for further discussions to bridge concerns over the inclusivity of the process, the sources added. Read More Here 11 February 2025, The Conversation: Earth is already shooting through the 1.5°C global warming limit, two major studies show. Earth is crossing the threshold of 1.5°C of global warming, according to two major global studies which together suggest the planet’s climate has likely entered a frightening new phase. Under the landmark 2015 Paris Agreement on climate change, humanity is seeking to reduce greenhouse gas emissions and keep planetary heating to no more than 1.5°C above the pre-industrial average. In 2024, temperatures on Earth surpassed that limit. This was not enough to declare the Paris threshold had been crossed, because the temperature goals under the agreement are measured over several decades, rather than short excursions over the 1.5°C mark. But the two papers just released use a different measure. Both examined historical climate data to determine whether very hot years in the recent past were a sign that a future, long-term warming threshold would be breached. The answer, alarmingly, was yes. The researchers say the record-hot 2024 indicates Earth is passing the 1.5°C limit, beyond which scientists predict catastrophic harm to the natural systems that support life on Earth. Read More Here 24 November 2024, Carbon Brief: COP29: Key outcomes agreed at the UN climate talks in Baku. Developed nations have agreed to help channel “at least” $300bn a year into developing countries by 2035 to support their efforts to deal with climate change. However, the new climate-finance goal – agreed along with a range of other issues at the COP29 summit in Baku, Azerbaijan – has left developing countries bitterly disappointed. They were united in calling for developed countries to raise $1.3tn a year in climate finance. In the end, negotiators agreed on a looser call to raise $1.3tn each year from a wide range of sources, including private investment, by 2035. Some countries, including India and Nigeria, accused the COP29 presidency of pushing the deal through without their proper consent, following chaotic last-minute negotiations. Countries failed to reach an agreement on how the outcomes of last year’s “global stocktake”, including a key pledge to transition away from fossil fuels, should be taken forward – instead shunting the decision to COP30 next year in Brazil. They did manage to find agreement on the remaining sections of Article 6 on carbon markets, meaning all elements of the Paris Agreement have been finalised nearly 10 years after it was signed. Negotiations were overshadowed by the reelection of Donald Trump, who has promised to roll back climate action and take the world’s biggest historical emitter out of the Paris Agreement once again. Read more here: 14 November 2024, BBC: Málaga evacuates thousands as Spain issues more flood alerts. Thousands of people have been evacuated from their homes in the Costa del Sol region of southern Spain as extreme rain and flooding drenches the area. National weather office Aemet has placed both Malaga and the northeastern Catalonia region on the highest alert for strong rain expected to last until Friday. The Malaga area, including the tourist resorts of Marbella, Velez and Estepona, is expected to take the brunt of the extreme weather phenomenon known as a “Dana”. Parts of the eastern Valencia area have also been placed on the highest alert, weeks after the area was devastated by flash floods that killed more than 220 people. Several other regions in Spain remain braced for more heavy showers and low temperatures. Up to 180mm of rain could fall in Catalonia in north-eastern Spain in just 12 hours, accompanied by thunderstorms along the coast near Tarragona, forecasters say. Schools in the entire southern province of Málaga have been closed while many supermarkets have kept shutters down. Footage circulating on social media showed the city’s normally busy areas deserted as water flooded the streets. Around 3,000 people living in close proximity to the Guadalhorce River have been told to leave their homes, the Regional Government of Andalusia has said. Read more here 27 January 2025, Carbon Brief: A record surge of clean energy kept China’s carbon dioxide (CO2) emissions below the previous year’s levels in the last 10 months of 2024. However, the new analysis for Carbon Brief, based on official figures and commercial data, shows the tail end of China’s rebound from zero-Covid in January and February, combined with abnormally high growth in energy demand, stopped CO2 emissions falling in 2024 overall. While China’s CO2 output in 2024 grew by an estimated 0.8% year-on-year, emissions were lower than in the 12 months to February 2024. Other key findings of the analysis include: As ever, the latest analysis shows that policy decisions made in 2025 will strongly affect China’s emissions trajectory in the coming years. In particular, both China’s new commitments under the Paris Agreement and the country’s next five-year plan are being prepared in 2025. Read More Here 3 November 2020, Carbon Brief: Hydrogen gas has long been recognised as an alternative to fossil fuels and a potentially valuable tool for tackling climate change. Now, as nations come forward with net-zero strategies to align with their international climate targets, hydrogen has once again risen up the agenda from Australia and the UK through to Germany and Japan. In the most optimistic outlooks, hydrogen could soon power trucks, planes and ships. It could heat homes, balance electricity grids and help heavy industry to make everything from steel to cement. But doing all these things with hydrogen would require staggering quantities of the fuel, which is only as clean as the methods used to produce it. Moreover, for every potentially transformative application of hydrogen, there are unique challenges that must be overcome. In this in-depth Q&A – which includes a range of infographics, maps and interactive charts, as well as the views of dozens of experts – Carbon Brief examines the big questions around the “hydrogen economy” and looks at the extent to which it could help the world avoid dangerous climate change. Access full article here Fossil fuel emissions have stalled 14 November 2016, The Conversation, Fossil fuel emissions have stalled: Global Carbon Budget 2016. For the third year in a row, global carbon dioxide emissions from fossil fuels and industry have barely grown, while the global economy has continued to grow strongly. This level of decoupling of carbon emissions from global economic growth is unprecedented.Global CO₂ emissions from the combustion of fossil fuels and industry (including cement production) were 36.3 billion tonnes in 2015, the same as in 2014, and are projected to rise by only 0.2% in 2016 to reach 36.4 billion tonnes. This is a remarkable departure from emissions growth rates of 2.3% for the previous decade, and more than 3% during the 2000’s. Read More here Do you want to understand the complexity of energy systems which support our high consumption lifestyles? Most people don’t give too much thought to where their electricity comes from. Flip a switch, and the lights go on. That’s all. The origins of that energy, or how it actually got into our homes, is generally hidden from view. This link will take you to 11 maps which explain energy in America (it is typical enough as an example of a similar lifestyle as Australia – when I find maps for Oz I’ll add them in) e.g. above map showing the coal plants in the US. Source: Vox Explainers Mapped: how Germany generates its electricity – another example Power to the People – Lock the Gate looks back at the wins of 2015 And there’s lots more coming up in 2016. Some of the big priorities coming up next for the “Lock the Gate” movement are: If you want to give “Lock the Gate” your support – go here for more info This new report reveals that the pollution from Australia’s coal resources, particularly the enormous Galilee coal basin, could take us two-thirds of the way to a two degree rise in global temperature. To Read More and download report The 2006 UK government commissioned Stern Commission Review on the Economics of Climate Change is still the best complete appraisal of global climate change economics. The review broke new ground on climate change assessment in a number of ways. It made headlines by concluding that avoiding global climate change catastrophe was almost beyond our grasp. It also found that the costs of ignoring global climate change could be as great as the Great Depression and the two World Wars combined. The review was (still is) in fact a very good assessment of global climate change, which inferred in 2006 that the situation was a global emergency. Read More here The Garnaut Climate Change Review was commissioned by the Commonwealth, state and territory governments in 2007 to conduct an independent study of the impacts of climate change on the Australian economy. Prof. Garnaut presented The Garnaut Climate Change Review: Final Report to the Australian Prime Minister, Premiers and Chief Ministers in September 2008 in which he examined how Australia was likely to be affected by climate change, and suggested policy responses. In November 2010, he was commissioned by the Australian Government to provide an update to the 2008 Review. In particular, he was asked to examine whether significant changes had occurred that would affect the analysis and recommendations from 2008. The final report was presented May 2011. Since then the Professor has regularly participated in the debate of fossil fuel reduction, as per his latest below: To access his reports; interviews; submissions go here 27 May 2015, Renew Economy, Garnaut: Cost of stranded assets already bigger than cost of climate action. This is one carbon budget that Australia has already blown. Economist and climate change advisor Professor Ross Garnaut has delivered a withering critique of Australia’s economic policies and investment patterns, saying the cost of misguided over-investment in the recent mining boom would likely outweigh the cost of climate action over the next few decades. Read More here Live generation of electricity by fuel type Fossil Fuel Subsidies – The Age of entitlement continues 24 June 2014, Renew Economy, Age of entitlement has not ended for fossil fuels: A new report from The Australia Institute exposes the massive scale of state government assistance, totalling $17.6 billion over a six-year period, not including significant Federal government support and subsidies. Queensland taxpayers are providing the greatest assistance by far with a total of $9.5 billion, followed by Western Australia at $6.2 billion. The table shows almost $18 billion dollars has been spent over the past 6 years by state governments, supporting some of Australia’s biggest, most profitable industries, which are sending most of the profits offshore. That’s $18 billion dollars that could have gone to vital public services such as hospitals, schools and emergency services. State governments are usually associated with the provision of essential services like health and education so it will shock taxpayers to learn of the massive scale of government handouts to the minerals and fossil fuel industries. This report shows that Australian taxpayers have been misled about the costs and benefits of this industry, which we can now see are grossly disproportionate. Each state provides millions of dollars’ worth of assistance to the mining industry every year, with the big mining states of Queensland and Western Australia routinely spending over one billion dollars in assistance annually. Read More here – access full report here What is fossil fuel divestment? Local Governments ready to divest Aligning Council Money With Council Values A Guide To Ensuring Council Money Isn’t Funding Climate Change. 350.org Australia – with the help of the incredible team at Earth Hour – has pulled together a simple 3-step guide for local governments interested in divestment. The movement to align council money with council values is constantly growing in Australia. It complements the existing work that councils are doing to shape a safe climate future. It can also help to reshape the funding practices of Australia’s fossil fuel funding banks. The steps are simple. The impact is huge.The guide can also be used by local groups who are interested in supporting their local government to divest as a step-by-step reference point. Access guide here How coal is staying in the ground in the US Sierra Club Beyond Coal Campaign May 2015, Politico, Michael Grunwald: The war on coal is not just political rhetoric, or a paranoid fantasy concocted by rapacious polluters. It’s real and it’s relentless. Over the past five years, it has killed a coal-fired power plant every 10 days. It has quietly transformed the U.S. electric grid and the global climate debate. The industry and its supporters use “war on coal” as shorthand for a ferocious assault by a hostile White House, but the real war on coal is not primarily an Obama war, or even a Washington war. It’s a guerrilla war. The front lines are not at the Environmental Protection Agency or the Supreme Court. If you want to see how the fossil fuel that once powered most of the country is being battered by enemy forces, you have to watch state and local hearings where utility commissions and other obscure governing bodies debate individual coal plants. You probably won’t find much drama. You’ll definitely find lawyers from the Sierra Club’s Beyond Coal campaign, the boots on the ground in the war on coal. Read More here Oil – conventional & unconventional May 2015, Oil change International Report: On the Edge: 1.6 Million Barrels per Day of Proposed Tar Sands Oil on Life Support. The Canadian tar sands is among the most carbon-intensive, highest-cost sources of oil in the world. Even prior to the precipitous drop in global oil prices late last year, three major projects were cancelled in the sector with companies unable to chart a profitable path forward. Since the collapse in global oil prices, the sector has been under pressure to make further cuts, leading to substantial budget cuts, job losses, and a much more bearish outlook on expansion projections in the coming years. Read full report here. For summary of report USA Sierra Club Beyond Oil Campaign Coal Seam Gas battle in Australia Lock the Gate Alliance is a national coalition of people from across Australia, including farmers, traditional custodians, conservationists and urban residents, who are uniting to protect our common heritage – our land, water and communities – from unsafe or inappropriate mining for coal seam gas and other fossil fuels. Read more about the missions and principles of Lock the Gate. Access more Lock the Gate videos here. Access Lock the Gate fact sheets here 2014: Parliament of Victoria Research Paper: Unconventional Gas: Coal Seam Gas, Shale Gas and Tight Gas: This Research Paper provides an introduction and overview of issues relevant to the development of unconventional gas – coal seam, shale and tight gas – in the Australian and specifically Victorian context. At present, the Victorian unconventional gas industry is at a very early stage. It is not yet known whether there is any coal seam gas or shale gas in Victoria and, if there is, whether it would be economically viable to extract it. A moratorium on fracking has been in place in Victoria since August 2012 while more information is gathered on potential environmental risks posed by the industry. The parts of Victoria with the highest potential for unconventional gas are the Gippsland and Otway basins. Notably, tight gas has been located near Seaspray in Gippsland but is not yet being produced. There is a high level of community concern in regard to the potential impact an unconventional gas industry could have on agriculture in the Gippsland and Otway regions. Industry proponents, however, assert that conventional gas resources are declining and Victoria’s unconventional gas resources need to be ascertained and developed. Read More here 28 January 2015, ABC News, Coal seam gas exploration: Victoria’s fracking ban to remain as Parliament probes regulations: A ban on coal seam gas (CSG) exploration will stay in place in Victoria until a parliamentary inquiry hands down its findings, the State Government has promised. There is a moratorium on the controversial mining technique, known as fracking, until the middle of 2015. The Napthine government conducted a review into CSG, headed by former Howard government minister Peter Reith, which recommended regulations around fracking be relaxed. Labor was critical of the review, claiming it failed to consult with farmers, environmental scientists and local communities. Read more here Keep up to date and how you can be involved here Friends of the Earth Melbourne Coal & Gas Free Victoria 20 May 2015, FoE, Inquiry into Unconventional Gas: Check here for details on the Victorian government’s Inquiry into unconventional gas. The public hearings have not yet started, however the Terms of Reference have been released. The state government’s promised Inquiry into Unconventional Gas has now been formally announced, with broad terms of reference (TOR). FoE’s response to the TOR is available here. The Upper House Environment and Planning Committee will manage the Inquiry. You can find the Inquiry website here. The final TOR will be determined by the committee. Significantly, it is a cross party committee. The Chair is a Liberal (David Davis), and there is one National (Melinda Bath), one Green (Samantha Dunn), three from the ALP (Gayle Tierney, Harriet Shing, Shaun Leane), an additional MP from the Liberals (Richard Dalla-Riva), and one MP from the Shooters Party (Daniel Young). Work started by the previous government, into water tables and the community consultation process run by the Primary Agency, will be released as part of the inquiry.The moratorium on unconventional gas exploration will stay in place until the inquiry delivers its findings. The interim report is due in September and the final report by December. There is the possibility that the committee will amend this timeline if they are overwhelmed with submissions or information. Parliament will then need to consider the recommendations of the committee and make a final decision about how to proceed. This is likely to happen when parliament resumes after the summer break, in early 2016. Quit Coal is a Melbourne-based collective that campaigns against the expansion of the coal and unconventional gas industries in Victoria. Quit Coal uses a range of tactics to tackle this problem. We advise the broader Victorian community about plans for new coal and unconventional gas projects, we put pressure on our government to stop investing in these projects, and we help to inform and mobilise Victorian communities so they can campaign on their own behalf. We focus on being strategic, creative, and as much as possible, fun! The above screen shot is of the Victorian State government’s Mining Licences Near Me site. Go to this link to see what is happening in your area Environment Victoria’s campaign CoalWatch is an interactive resource that tracks the coal industry’s expansion plans and helps builds a movement to stop these polluting developments. CoalWatch provides a way for everyday Victorians to keep track of the coal industry’s ambitious expansion plans. To check what tax-payer money has been pledged to brown coal projects and the coal projects industry is spruiking to our politicians. Here’s another map via EV website (go to their website and you should be able to get better detail from Google Maps: Red areas: Exploration licences (EL). These areas are held by companies to undertake exploration activity. A small bond is held by government in case of any damage. If a company wants to progress the project it needs to obtain a mining licence. Exploration Licence applications are marked with an asterix in the Places Index eg. EL4684*. Yellow areas: Mining Licences (MIN). A mining licence is granted with the expectation that mining will occur. A larger bond is paid to government. Green areas: Exploration licences that have been withdrawn or altered due to community concern. Green outline: Existing mines within Mining Licences. Purple areas: Geological Carbon Storage Exploration areas for carbon capture and storage. On-shore areas have been released by the State Government, while off-shore areas have been released by the Federal Government. The Coal Watch wiki tracks current and future Victorian coal projects, whether they are power stations, coal mines, proposals to export coal or some other inventive way of burning more coal. To get the full picture of coal in Victoria visit our wiki page. Get more info and see the full list of Exploration Licences current at 17 August 2012 here August 2015, Institute for Energy Economics & Financial Analysis – powerpoint: Changing Dynamics in the Global Seaborne Thermal Coal Markets and Stranded Asset Risk. Information from one of the slides follows. To view full presentation go here Economic Implications for Australia 83% of Australian coal mines are foreign owned, hence direct leverage of fossil fuels to the ASX is relatively small at 1-2%. However, for Australia the exposure is high, time is needed for transition and the new industry opportunities are significant: 1. Energy Infrastructure: Australia spends $5-10bn pa on electricity / grid sector, much of it a regulated asset base that all ratepayers fund much of it stranded. BNEF estimate of Australia’s renewable energy infrastructure investment for 2015-2020 was cut 30% from A$20bn post RET. Lost opportunities. 2. Direct employment: The ABS shows a fall of ~20k from the 2012 peak of 70K from coal mining across Australia, and cuts are ongoing. Indirect employment material. 3. Terms of trade: BZE estimates the collapse in the pricing of iron ore, coal and LNG cuts A$100bn pa from Australia’s export revenues by 2030, a halving relative to government budget estimates of 2013/14. Coal was 25% of NSW’s total A$ value of exports in 2013/14 (38% of Qld). Australia will be #1 globally in LNG by 2018. 4. The financial sector: is leveraged to mining and associated rail port infrastructure. WICET 80% financed by banks, mostly Australian. Adani’s Abbot Point Port is foreign owned, but A$1.2bn of Australian sourced debt. Insurance firms and infrastructure funds are leveraged to fossil fuels vs little RE infrastructure assets. BBY! 5. Rehabilitation: $18bn of unfunded coal mining rehabilitation across Australia. 6. Economic growth: curtailed as Australia fails to develop low carbon industries.
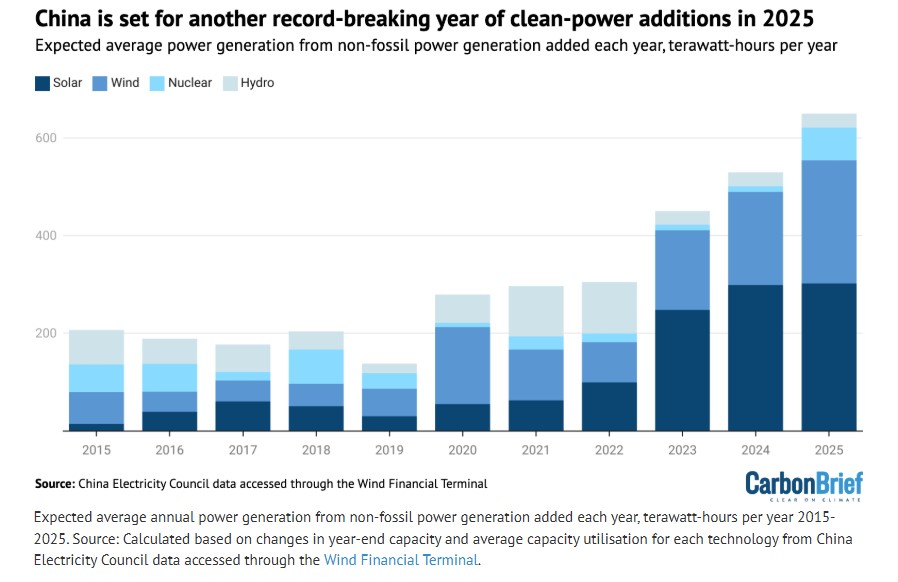
Analysis: Record surge of clean energy in 2024 halts China’s CO2 rise
In-depth Q&A: Does the world need hydrogen to solve climate change?
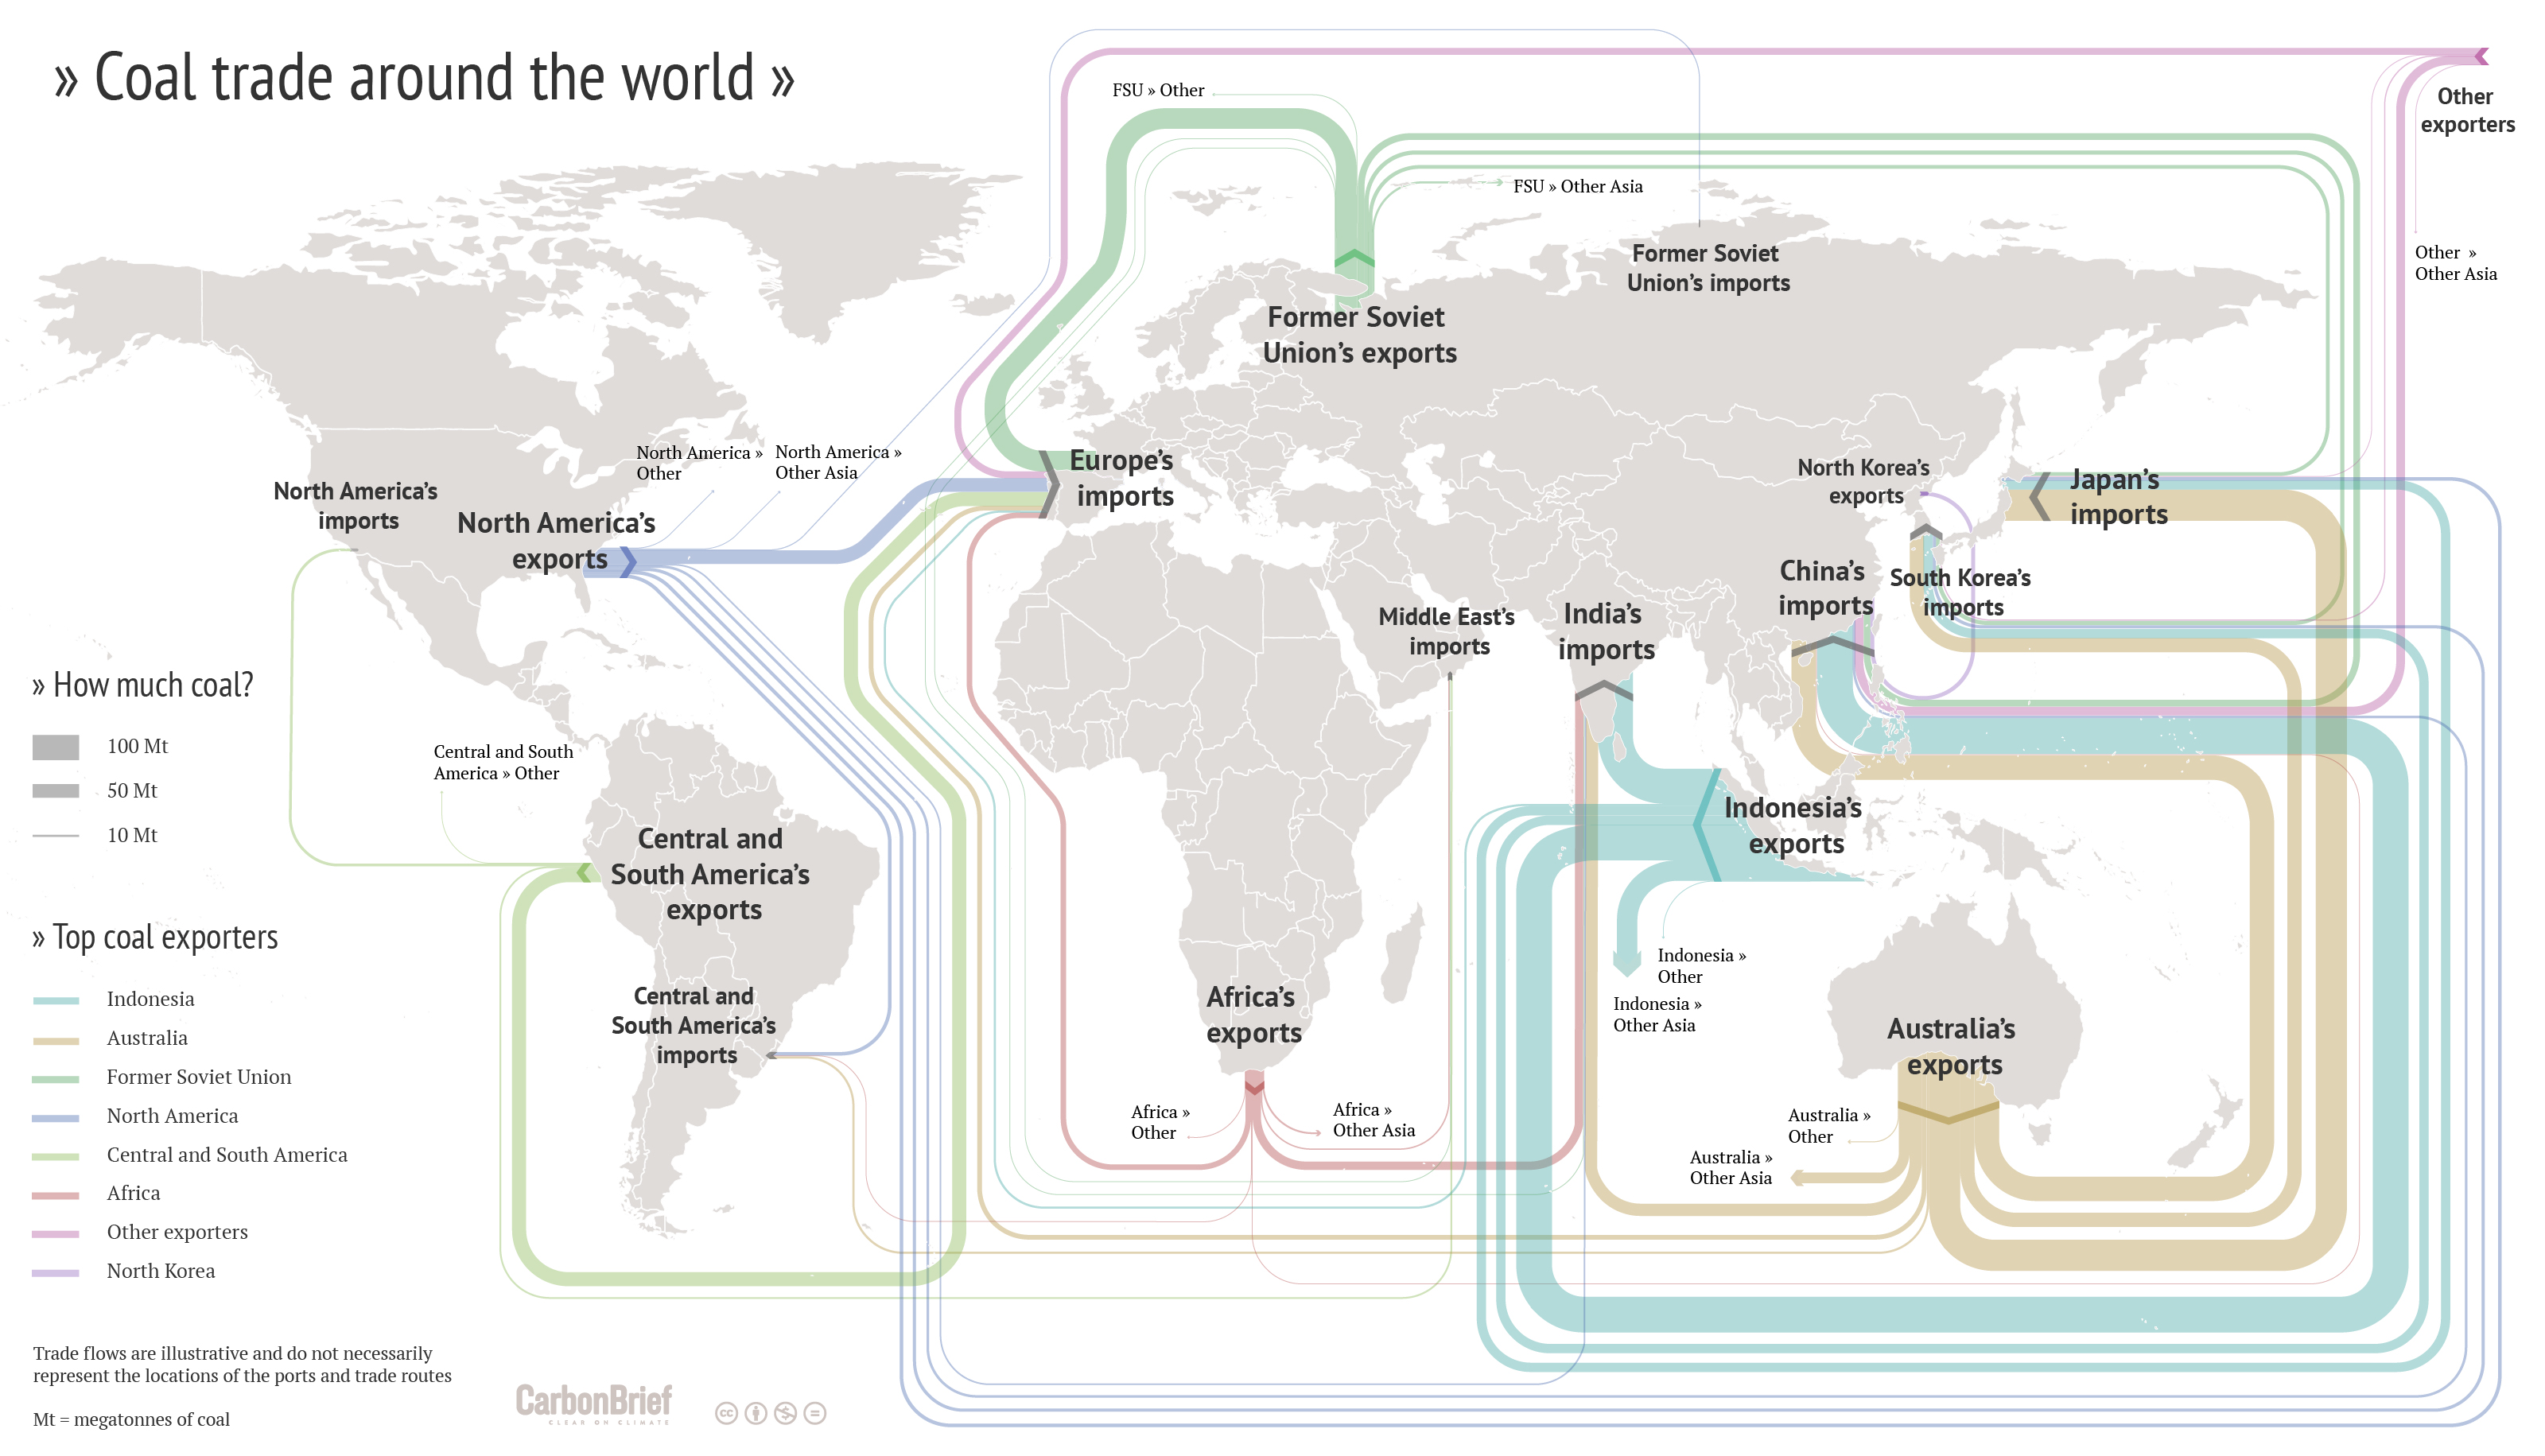 3 May 2016, Carbon Brief, The global coal trade doubled in the decade to 2012 as a coal-fueled boom took hold in Asia. Now, the coal trade seems to have stalled, or even gone into reverse. This change of fortune has devastated the coal mining industry, with Peabody – the world’s largest private coal-mining company – the latest of 50 US firms to file for bankruptcy. It could also be a turning point for the climate, with the continued burning of coal the biggest difference between business-as-usual emissions and avoiding dangerous climate change. Carbon Brief has produced a series of maps and interactive charts to show how the global coal trade is changing. As well as providing a global overview, we focus on a few key countries: Read More here
/cdn0.vox-cdn.com/uploads/chorus_asset/file/3915730/EIA%20coal%20power%20plants.png)
21 April 2015, Climate Council, Will Steffen: Unburnable Carbon: Why we need to leave fossil fuels in the ground.Stern Commission Review
Australia’s Garnaut Review
 November 2014 – The Fossil Fuel Bailout: G20 subsidies for oil, gas and coal exploration report: Governments across the G20 countries are estimated to be spending $88 billion every year subsidising exploration for fossil fuels. Their exploration subsidies marry bad economics with potentially disastrous consequences for climate change. In effect, governments are propping up the development of oil, gas and coal reserves that cannot be exploited if the world is to avoid dangerous climate change. This report documents, for the first time, the scale and structure of fossil fuel exploration subsidies in the G20 countries. The evidence points to a publicly financed bailout for carbon-intensive companies, and support for uneconomic investments that could drive the planet far beyond the internationally agreed target of limiting global temperature increases to no more than 2ºC. It finds that, by providing subsidies for fossil fuel exploration, the G20 countries are creating a ‘triple-lose’ scenario. They are directing large volumes of finance into high-carbon assets that cannot be exploited without catastrophic climate effects. They are diverting investment from economic low-carbon alternatives such as solar, wind and hydro-power. And they are undermining the prospects for an ambitious climate deal in 2015. Access full report here For the summary on Australia’s susidisation of it’s fossil fuel industry go to page 51 of the report. The report said that the United States and Australia paid the highest level of national subsidies for exploration in the form of direct spending or tax breaks. Overall, G20 country spending on national subsidies was $23 billion. In Australia, this includes exploration funding for Geoscience Australia and tax deductions for mining and petroleum exploration. The report also classifies the Federal Government’s fuel rebate program for resources companies as a subsidy.